
HELP IS AT HAND!
 Question, comment, critique? We are here to help and we strive to make our site a comprehensive, user friendly experience. Contact us at DARTS@maine.edu.
You can calculate the change from prior year using DAX.
Example:
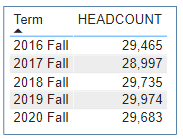
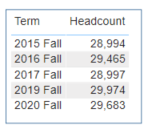
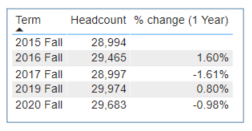
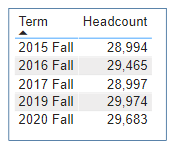
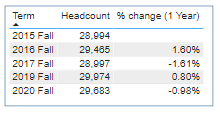
You have data for enrollment by term and you want to show the percent change from the prior year.
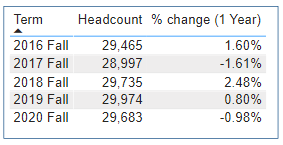
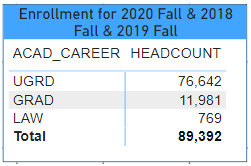
Start: Goal:
Steps:
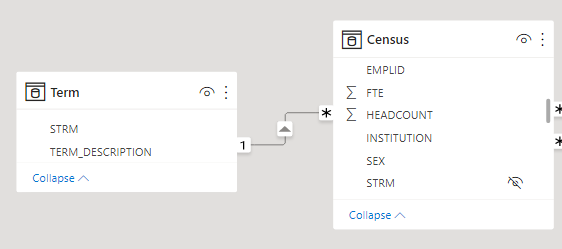
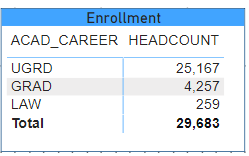
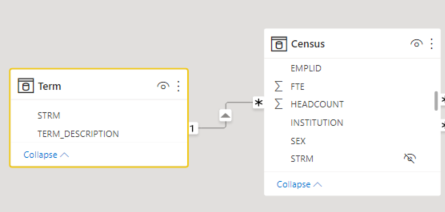
- Data model : You need a time dimension and the dimension has the field that is calculatable. This model has "Term" dimension and STRM is joining to Census table (fact) and the STRM field can be used for the calculation. The "Census" table has headcount field and the headcount can be summed to get the total headcount.
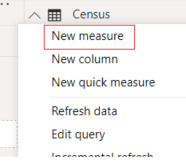
- Create measures:
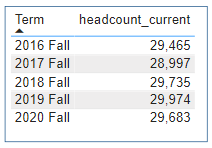
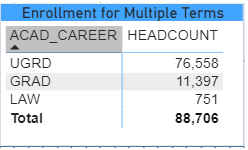
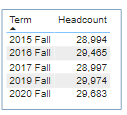
Four new measures will be created.headcount_current : calculate headcount for the current term.
There will be two variable in this DAX. (The variable line starts with "VAR" and the next word is the variable name.) The first variable is "currentTerm" and it picks the most recent term selected for the visual. The second variable. output, will be the final result you will get from this measure. It calculates the total headcount based on the first variable (currentTerm).headcount_current = VAR currentTerm = MAX ( Term[STRM] ) VAR output = CALCULATE ( SUM(Census[HEADCOUNT]), FILTER ( ALL ( Term ), Term[STRM] = currentTerm) ) RETURN outputOutput is the same as the visual started with.
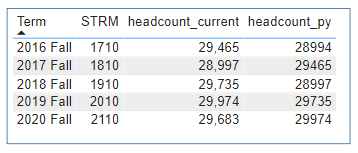
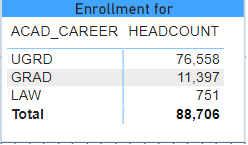
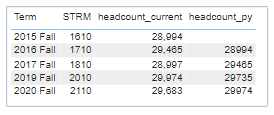
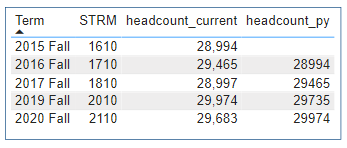
headcount_py : headcount for the prior year. The difference between current term (STRM) to the prior year's term is 100. If you want to use for 3 year change, it would be 300. The measure created on the previous step (headcount_current) was used to calculate.
headcount_py =
VAR currentTerm =
	MAX ( Term[STRM] )
VAR output =
	CALCULATE (
	SUM(Census[HEADCOUNT]),
	FILTER ( ALL ( Term ), Term[STRM] = currentTerm -100)
	)
RETURN
	output
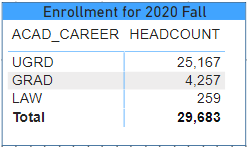
Output now shows prior year's headcount. STRM field was added to help visualize the calculation.
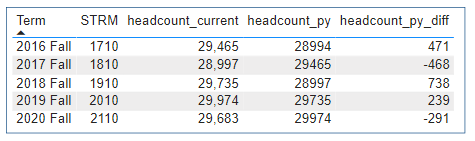
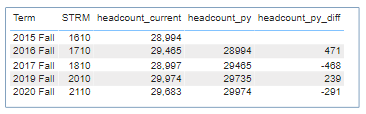
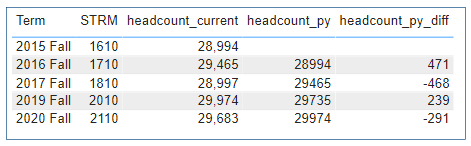
headcount_py_diff : calculate difference for current headcount and prior headcount. Additional DAX for dealing with blank values is added here.
headcount_py_diff = IF(NOT(ISBLANK([headcount_PY])), [headcount_current]-[headcount_PY], BLANK())
Output:
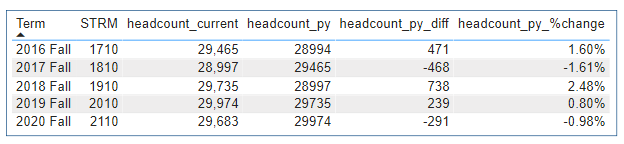
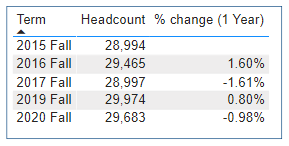
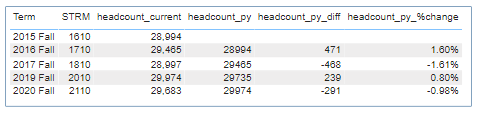
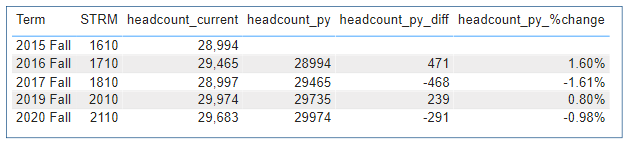
headcount_py_%change : calculate the percent of change from the prior year. You may also need to change the formatting of the field to % and change the decimal point.
headcount_py_%change = DIVIDE([headcount_py_diff], [headcount_current])
Output:
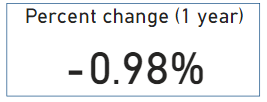
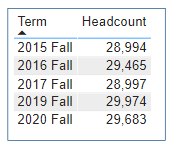
- Clean up visual
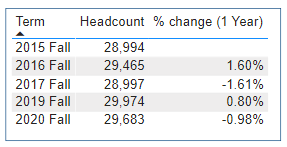
Adding each measures to the visual was helpful for validating data, however, some fields are not necessary to show on the report. Remove the unwanted fields and rename the header. Final output became like this:
Additional Notes:
The steps above shows each measure one by one, however, you can create the percent change within one measure. DAX can handle many variables (VAR).
You can create measures either way. Both ways have advantages.
headcount % change =
VAR currentTerm =
    MAX ( Term[STRM] )
VAR headcount_current =
    CALCULATE (
        SUM ( Census[HEADCOUNT] ),
        FILTER ( ALL ( Term ), Term[STRM] = currentTerm )
    )
VAR headcount_py =
    CALCULATE (
        SUM ( Census[HEADCOUNT] ),
        FILTER ( ALL ( Term ), Term[STRM] = currentTerm - 100 )
    )
VAR headcount_py_diff =
    IF (
        NOT ( ISBLANK ( headcount_py ) ),
        headcount_current-headcount_py,
        BLANK ()
    )
RETURN
    DIVIDE ( headcount_py_diff, headcount_current )
This calculation will work when the term is not in the same visual (e.g. card) based on the max term was selected for the page.