Multiple tools are available for reporting within University of Maine System. This page compares some of the tools available to Financials data users.
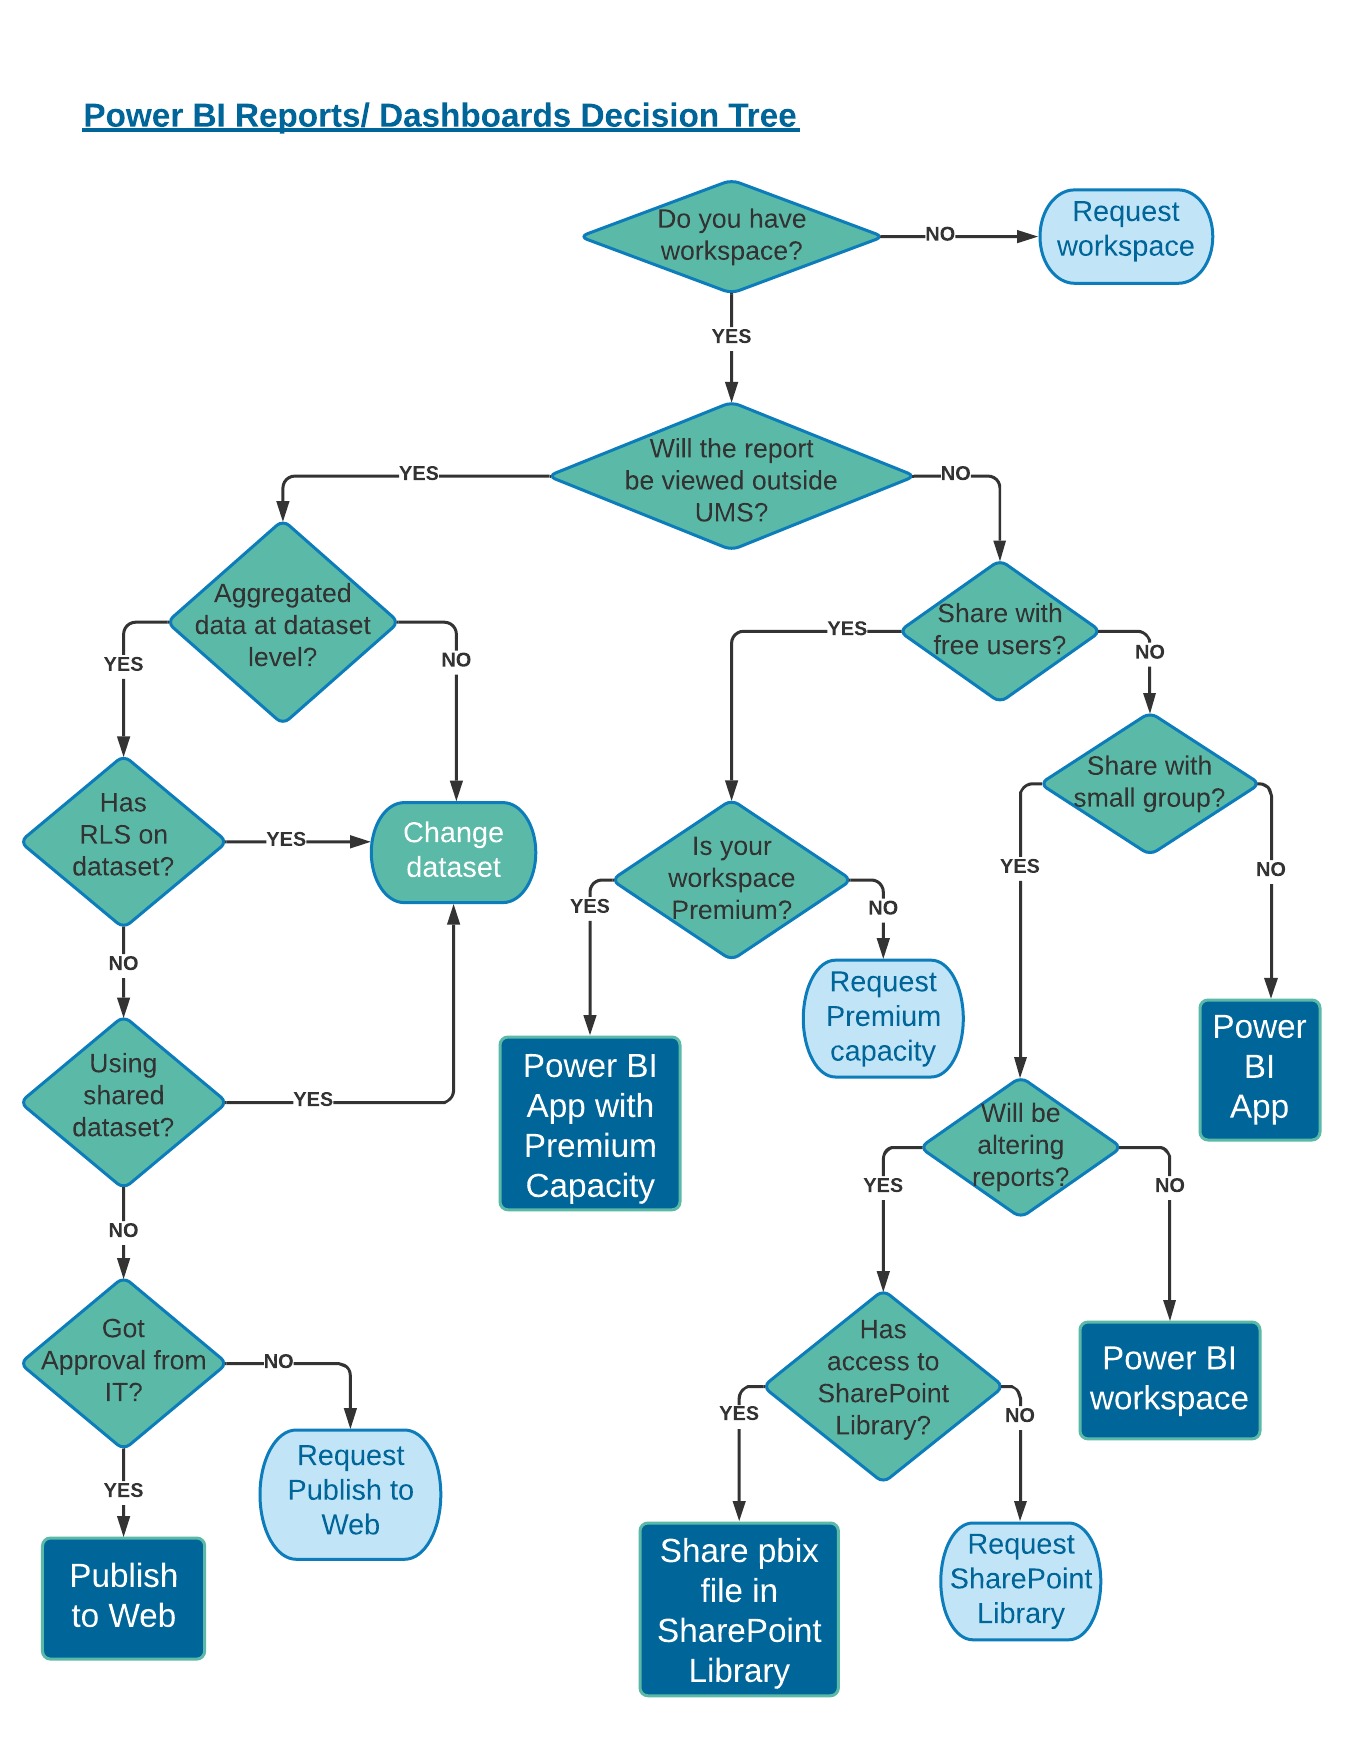
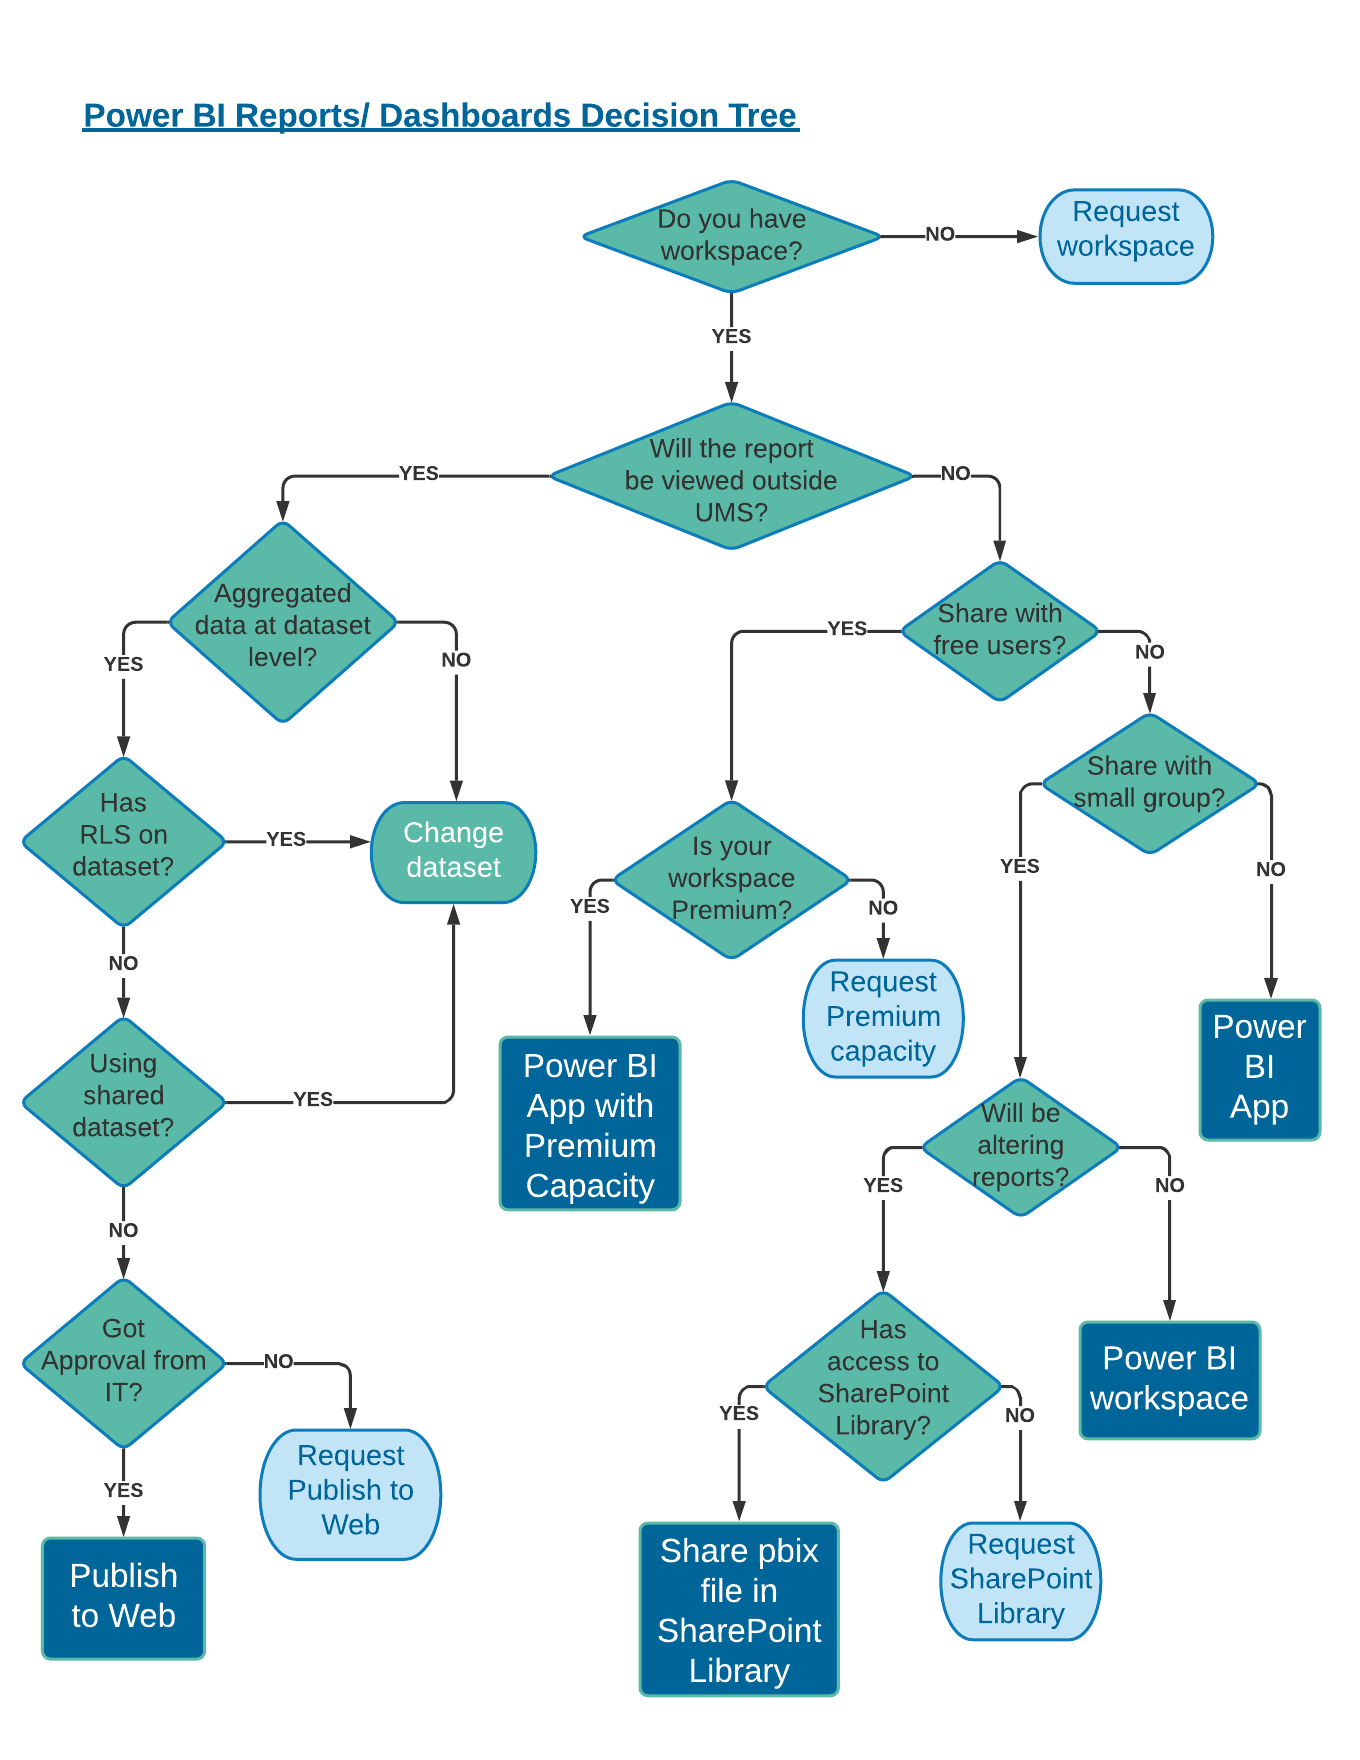
The first diagram shows the overall summary, and the table below compares the functions/features of each tool.
HELP IS AT HAND!
 Question, comment, critique? We are here to help and we strive to make our site a comprehensive, user friendly experience. Contact us at DARTS@maine.edu.
| Functions / features | PS Query | Power BI Report | Paginated Report |
|---|---|---|---|
Ease of use | easy | easy | easy |
Modification of report (When all fields are on the dataset) | medium | easiest | hard |
Print out/ Export to PDF | Only prints out what you can see on the screen | Only prints out what you can see on the screen | yes |
Export to Excel | yes | yes | yes |
Ability to share output | Need to download to Excel via file share or email | good | good |
Refresh data | Need to re-run the query | Spontaneous | Spontaneous |
Filter conditions | When running the query , you can set up conditions. Filtering the output requires Excel | Can select individual items Cannot add multiple “between” conditions, so create a new group on the model | Can select individual items Cannot add multiple “between” conditions, so create new group on the model |
Slicers | Not interactable | Interactable | Not interactable |
Custom field | medium | IT sets up initially then end user can modify if necessary | IT sets up initially then end user can modify if necessary |
Security | Built in security for some roles | IT will set up on dataset | IT will set up on dataset |
Subtotal label | No subtotal is available | Can add subtotals by field. Not showing the value of the field | Can add subtotals with the value of the field |