Power BI Reports can help make your job easier and more effectively show data into charts and graphs in meaningful ways.
Here are some commonly used functions available in Power BI reports which have been published to a public website.
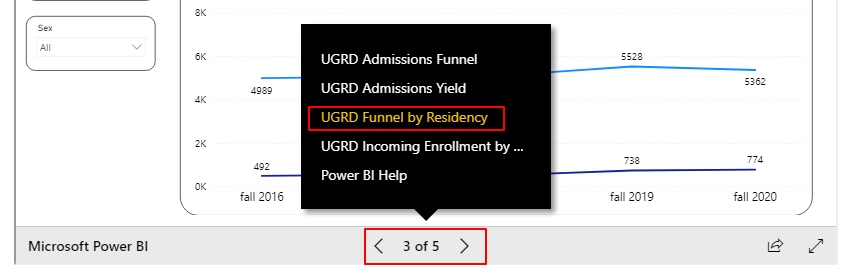
Page Navigation
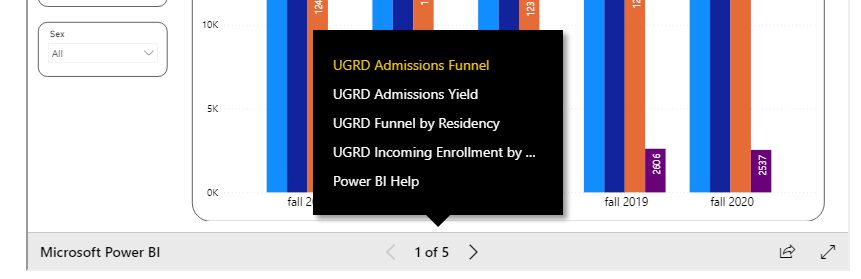
The bottom of the report frame shows the number of pages the report has. When you click the number, you will see a list with the titles of each page.
On this example, the report has 5 pages and you are seeing page 1, "UGRD Admissions Funnel." When you would like to go to a different page, you can simply click its title.

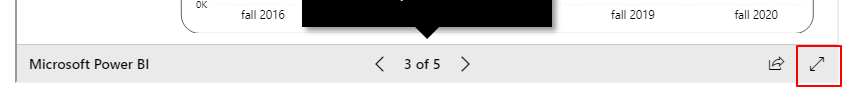
Open in full screen
When you would like to see the report in full screen, you can click the arrow at the right bottom corner of the report frame.

You can come back to the original screen by clicking this arrow icon ![]()
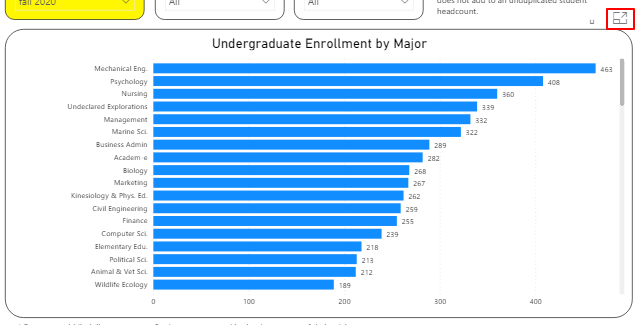
Look at one visual (Focus mode)
When you would like to see one visual, hover your mouse over the right top corner of the visual and click the small expand icon.

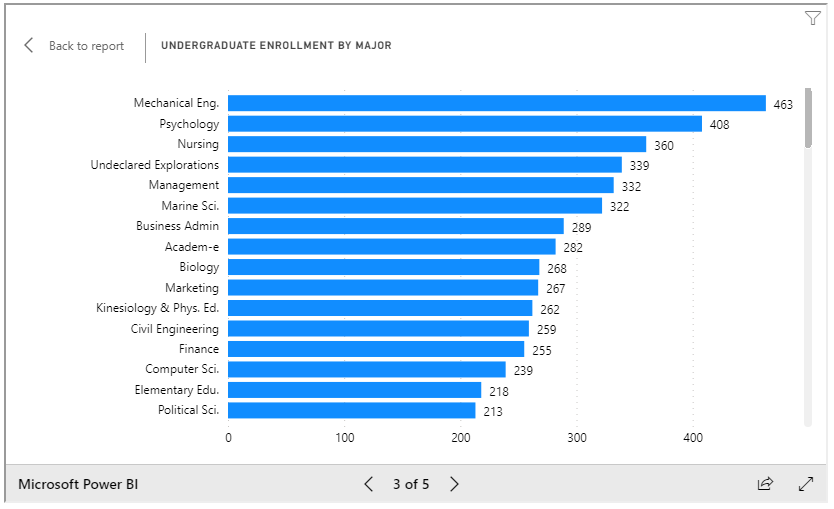
The window now shows the selected visual. Click "Back to report" to go back to the original screen.


HELP IS AT HAND!
 Question, comment, critique? We are here to help and we strive to make our site a comprehensive, user friendly experience. Contact us at DARTS@maine.edu.