What can you do as a consumer of a Power BI report?
Here are some commonly used functions available in Power BI reports.
Change size/view of a report
When the report is too small or too large, you can change the size of the view.
At the top right corner, there is a "View" button.

At the bottom right corner, there is a "Zoom" function you can slide.

Back to Top
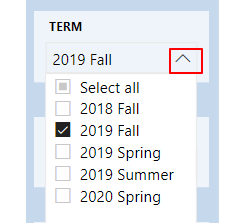
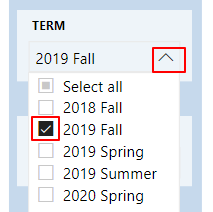
Filter a report using slicers
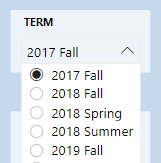
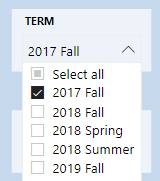
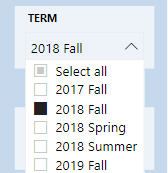
Filter the value(s) by clicking a slicer.
- If the selection is radio button, you can only choose one value.
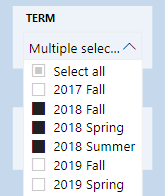
- If the selection is solid square, you can select multiple values by using Ctrl key.
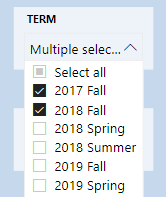
- If the selection is box with check mark, you can select multiple values by simply click.
Radio button
Solid square
Checkbox
Back to Top
Export a report to PowerPoint or PDF
You can export an entire report either to Power Point or as a PDF.
Click the drop down arrow for "Export" and choose "PowerPoint" or "PDF"

- Click the "Export" button and wait till it finishes exporting. Once it is done, you can download the file or PowerPoint file will be opened automatically.

NOTE: Since the export function above only captures what is visible on the page, the data is sometimes incomplete. To remedy this, you can see "Export data to Excel or CSV file" section below.
Back to Top
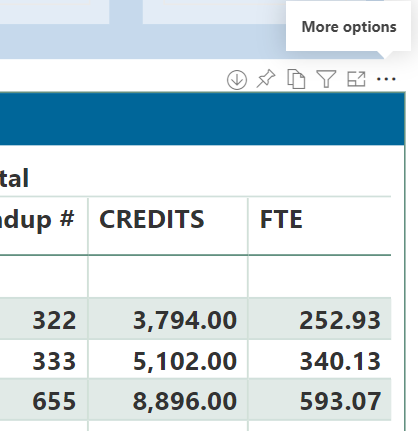
Export data to Excel or CSV file
- Hover over your mouse on the table or graph. Small gray icons will show up on the top corner (or bottom corner) of the table.

- Click the ellipse and choose "Export data"

- Click one of the options available on the pop-up window and click "Export". When "Data with current layout" option is selected, the file format will be xlsx. For other options, you can choose either xlsx or csv format.

The data will be downloaded and you can open the file when it finishes downloading.
More tip on Excel
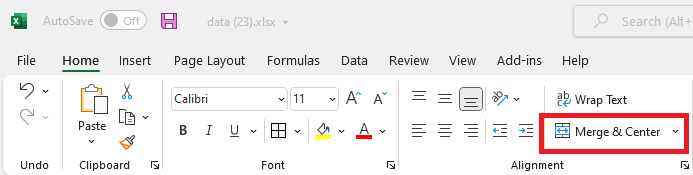
When "Data with current layout" option is used, the cells are merged on Excel output. 1) Select the entire Excel sheet and 2) click "Merge & Center" will unmerge the cells and populate the values on each cell.
Back to Top
Subscribe Report
You can subscribe and email report. This function is helpful when the report is refreshed frequently.
- Click "Subscribe"

- Click " + Add new subscription".

- Enter email address, subject line, and message. Set the frequency and the time. Click "Save and close".
Back to Top
Set Bookmarks
Bookmark remembers your selection of view of the report page or slicers. When you come back to report for the next time, you don't have to set all of the slicer.
- Select slicers or view of the report page for what you want to capture as bookmark
- Click the down arrow for "Bookmarks"

- Click "add a personal bookmark". Enter name for the bookmark and "Save".

- When you go back to the bookmark, you will see the list of bookmarks you created.
Back to Top
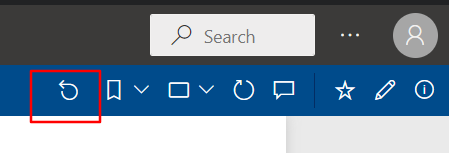
Reset to default
Click the "Reset to default" to reset filters, slicers, and other data view changes you've made. The report will go back to the default.

Back to Top
Change sort order in a visual
You can change the way the visual looks, for instance, change sort order of the visual
- Hover you mouse at the top right corner and click ellipses

- You can change to the descending order or ascending order
- You can change the sort by different field
Back to Top
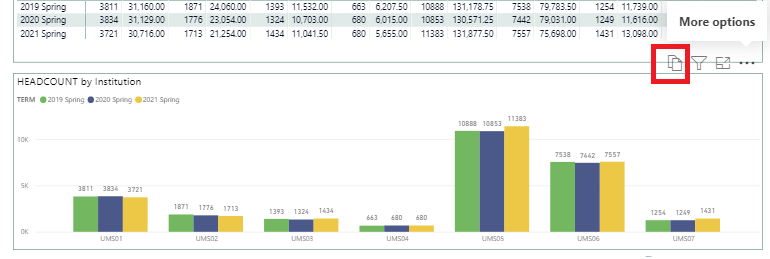
Copy a Visual
You can copy visual and paste it to your own document, such as PowerPoint or Word.
- Hover you mouse at the top right corner and click the first icon

- Click "Copy to clipboard" to copy the visual
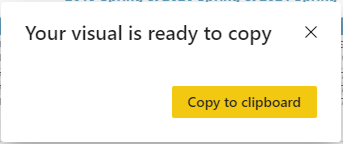
- Paste the visual
Back to Top
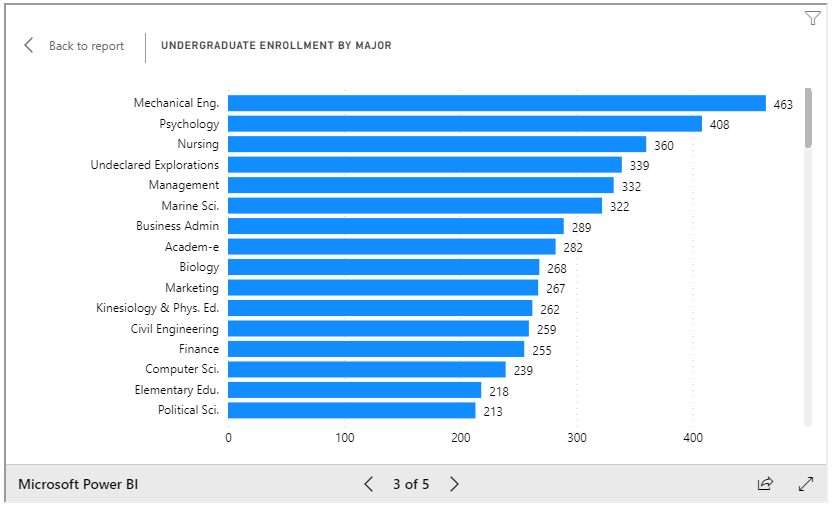
Show as a table
Some visuals may not show actual data values. "Show as a table" function will show the data next to a visual.
- Click the three dots at the right top corner of the visual, then choose "Show as a table"

- The data table will show up under or next to the visual

- Click "Back to report" to go back to the report
Back to Top

Detail instructions from Microsoft website
HELP IS AT HAND!
 Question, comment, critique? We are here to help and we strive to make our site a comprehensive, user friendly experience. Contact us at DARTS@maine.edu.
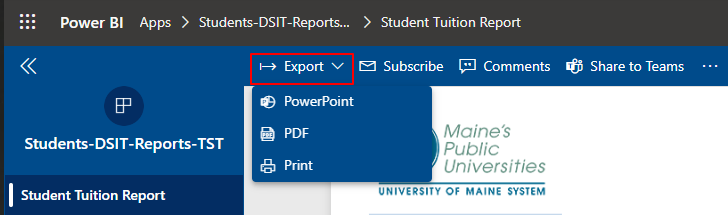