Navigating a Power BI Report
What can you do as a consumer of a Power BI report?
Power BI has powerful tools anyone can use to get the most out of their reports and dashboards. This page will explain some of the most common elements. Use the Quick Links menu at the left to jump to a topic you need.
Quick Links
Select an item for more information. Numbers correspond to the diagram at right.
 Menu Items
Top left menu items:
Top right menu items:
 App Contents
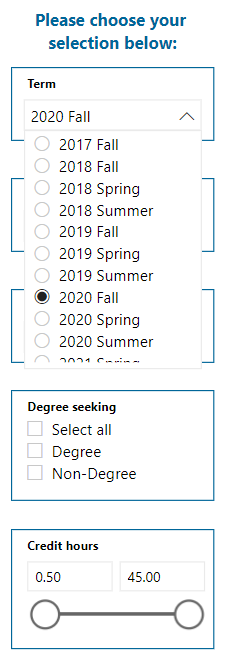
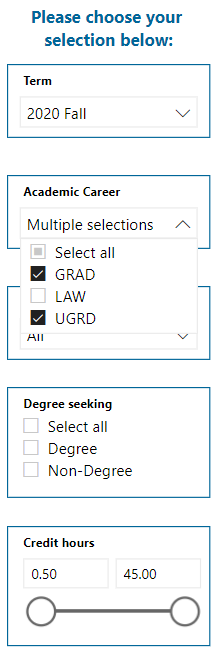
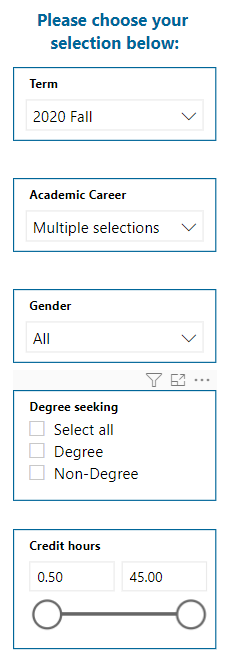
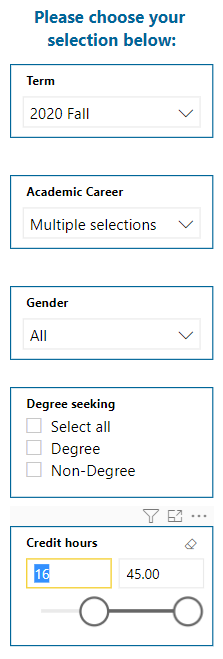
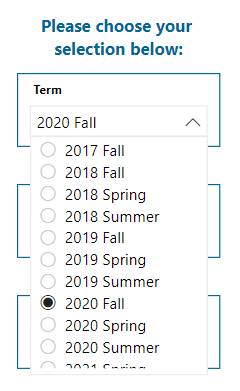
 Slicers
- Filter a report using slicers
 Visuals
 Buttons
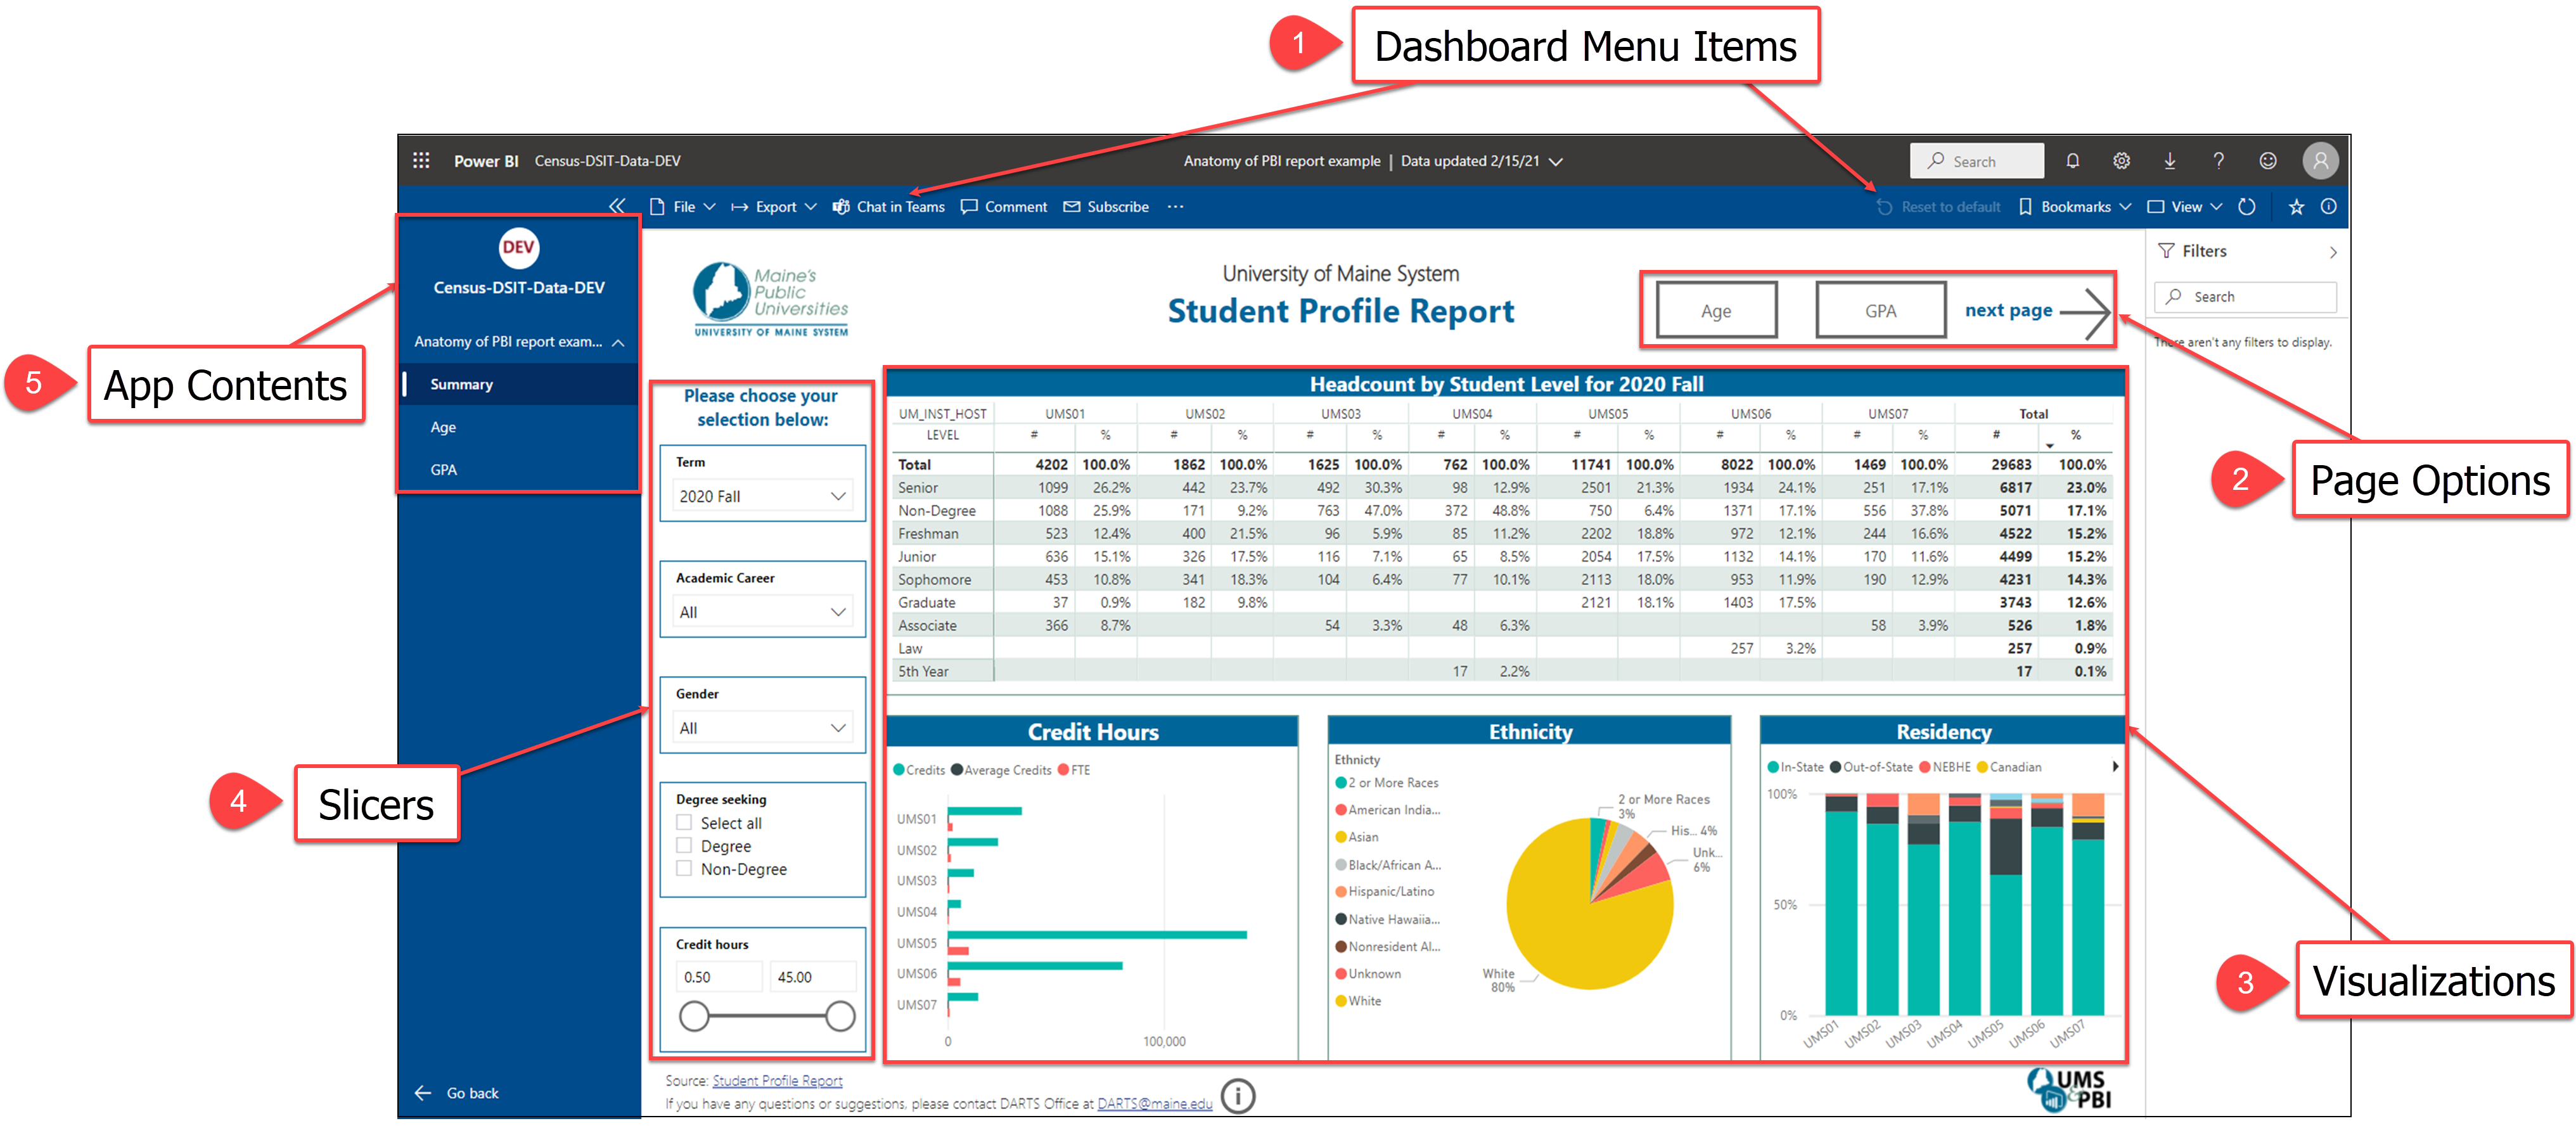
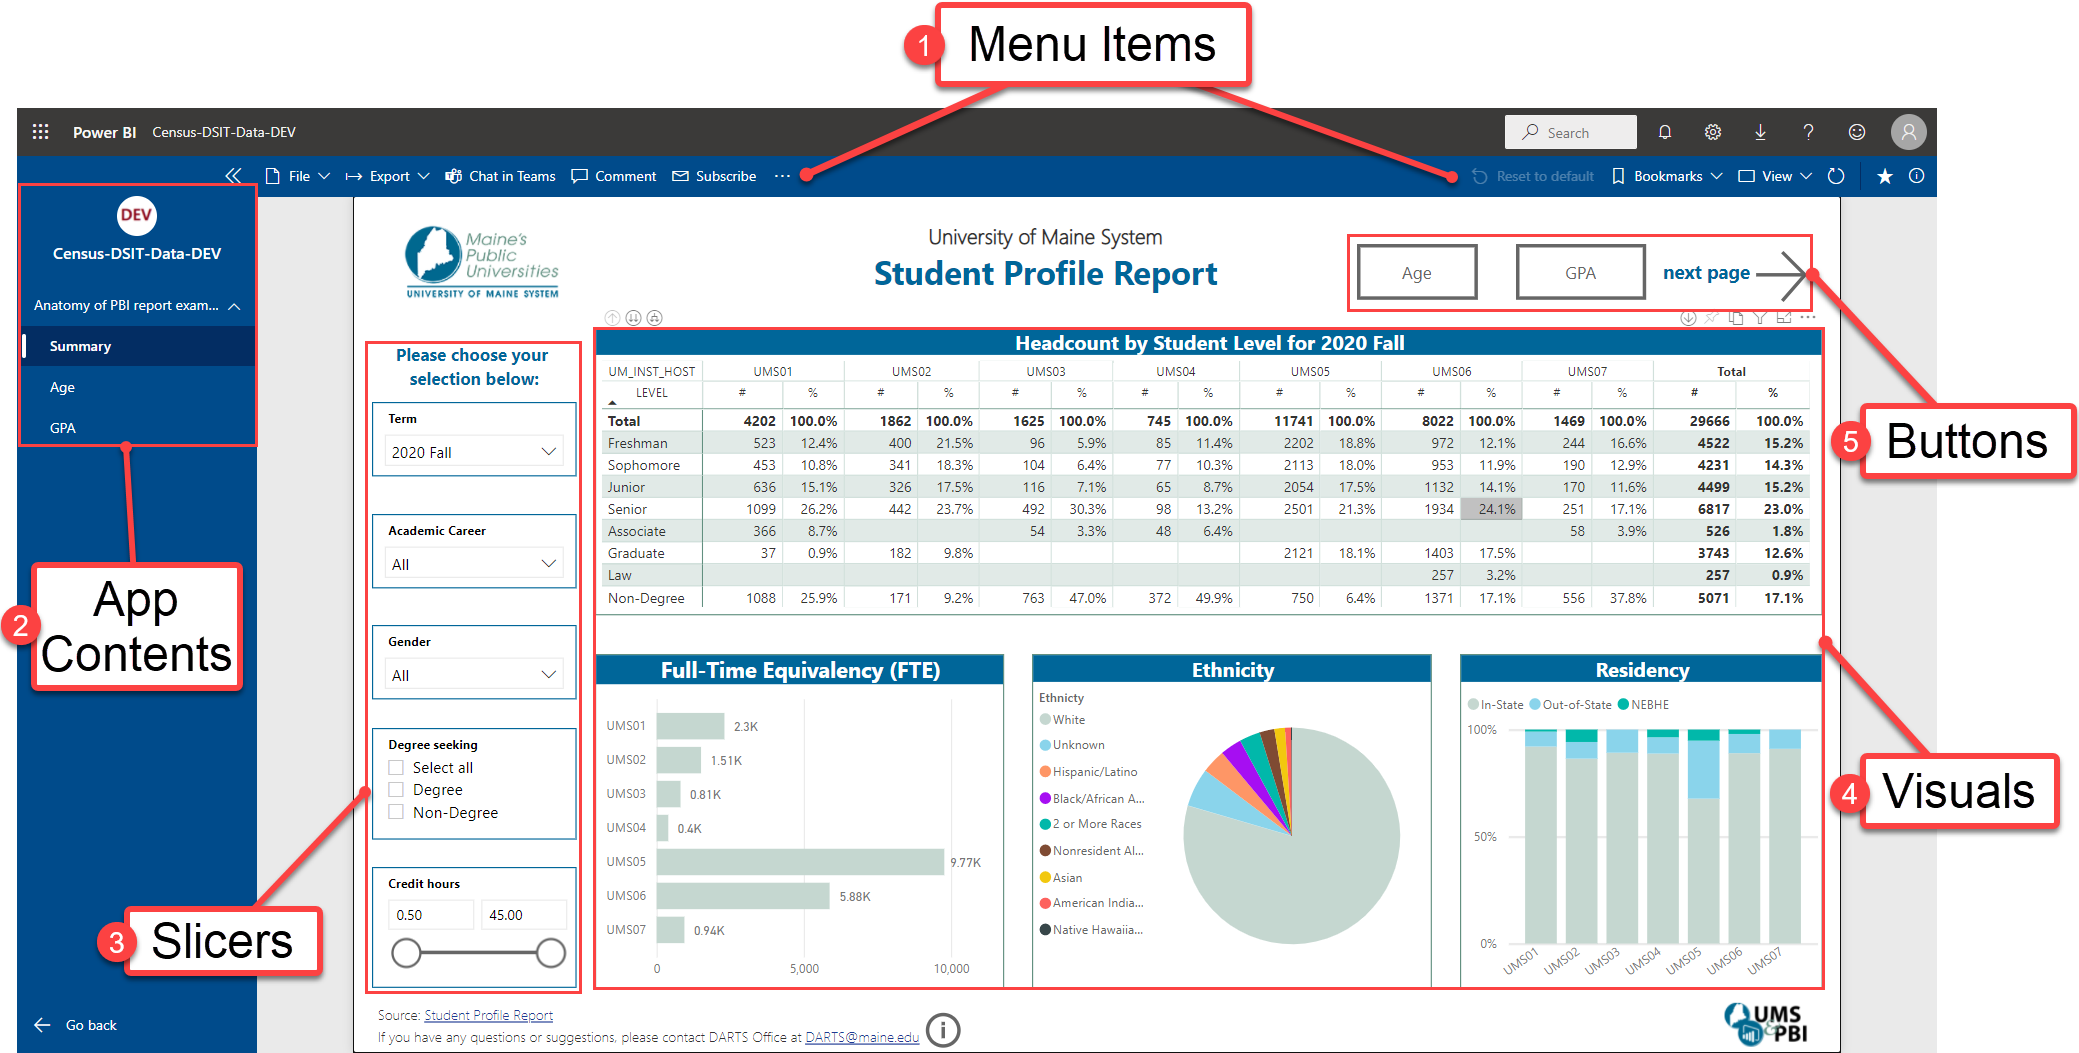
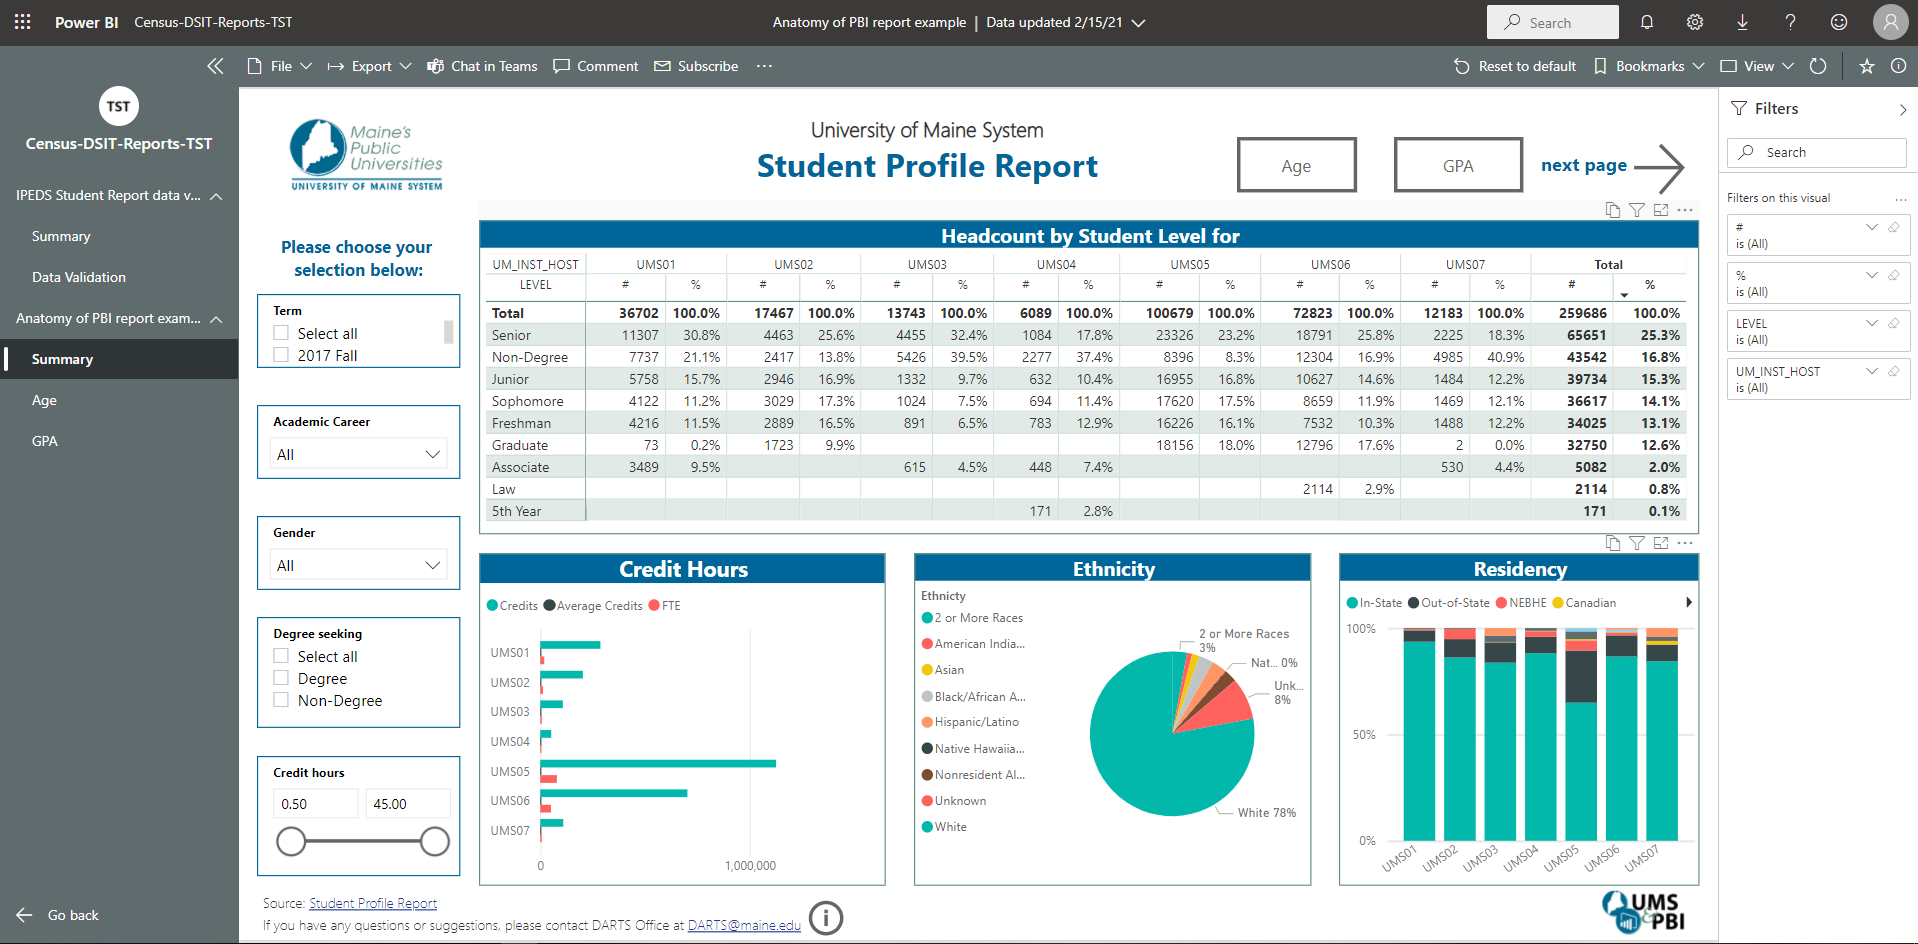
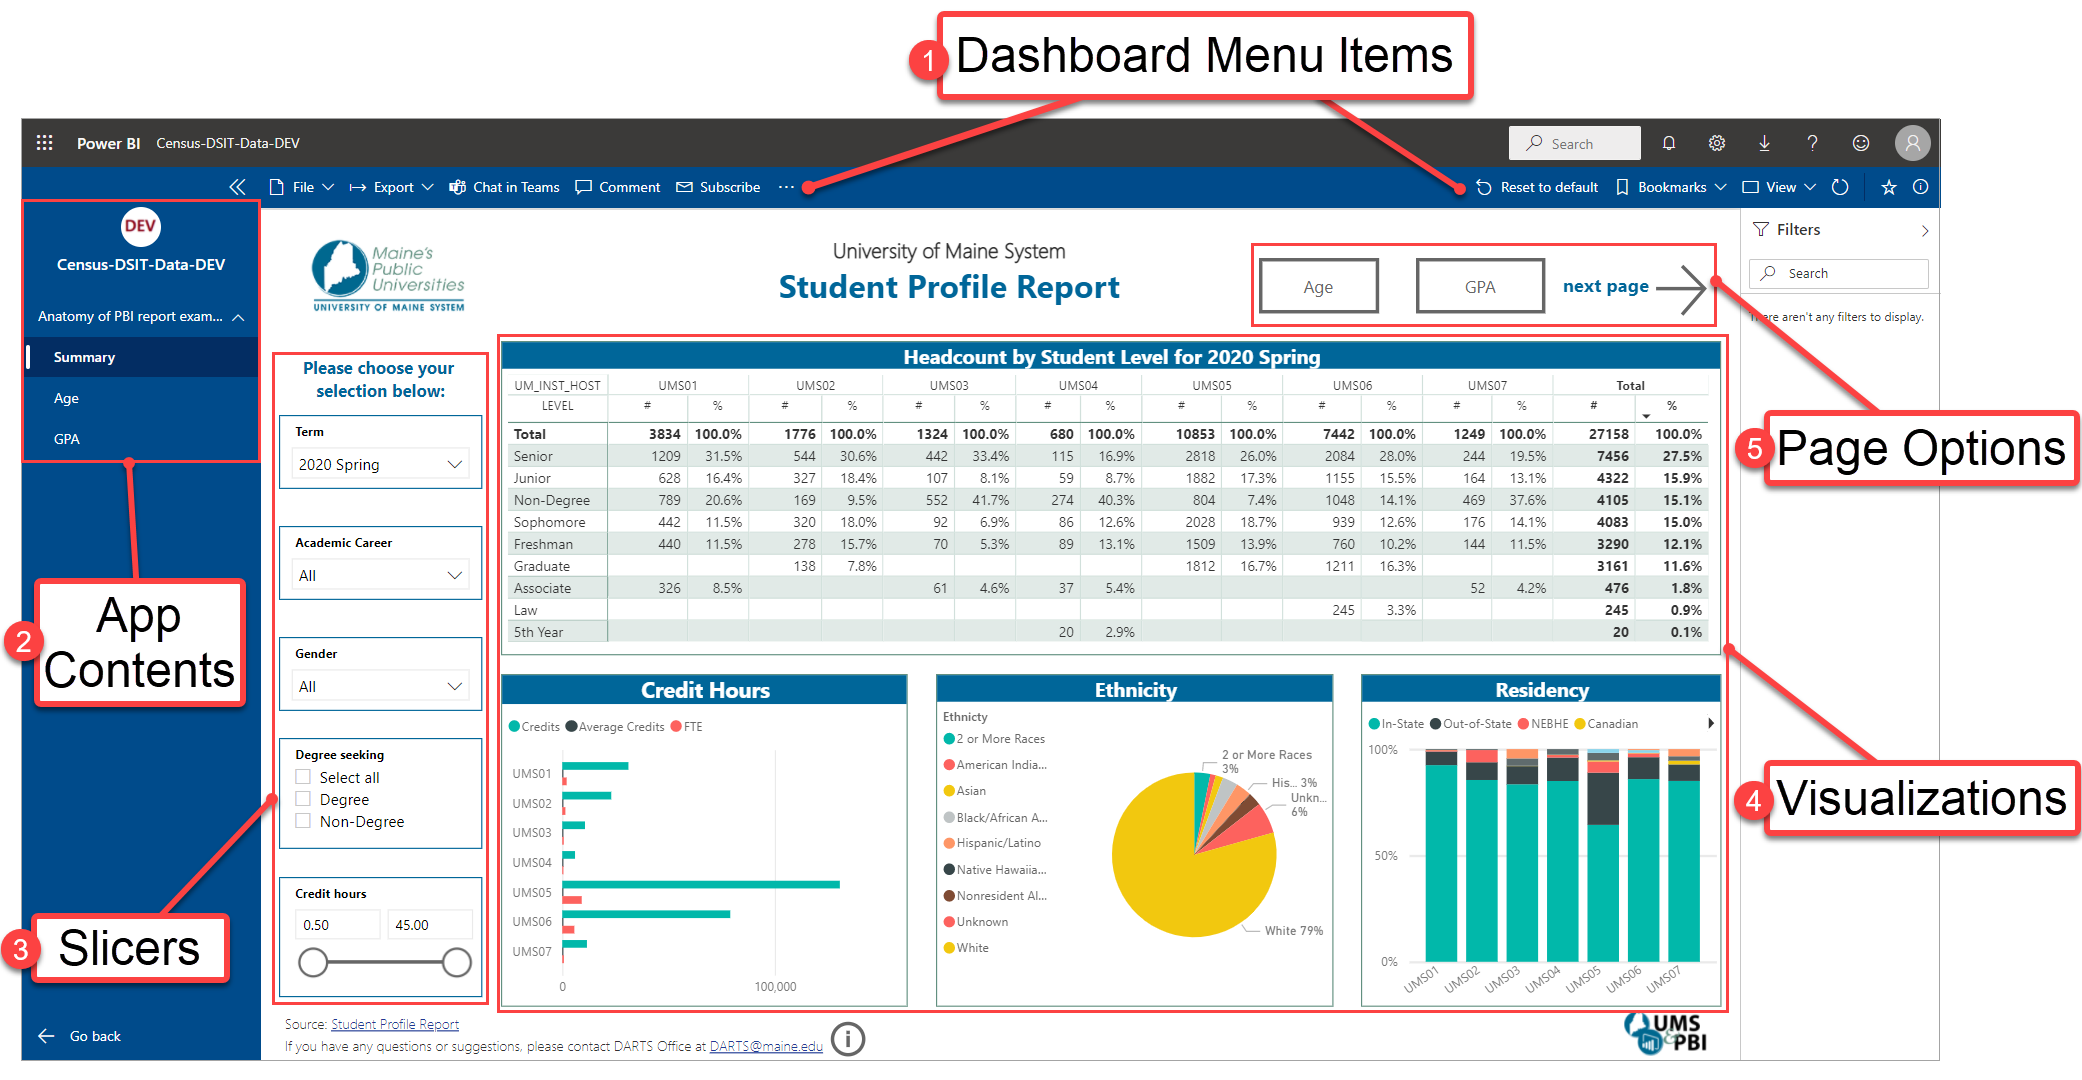
Items 1 and 2 in the image below are found in the canvas frame, and are seen on all reports. The remaining items 3-5 are found in the central canvas area inside the frame. They may differ in their look and feel—as well as their location on the screen—from report to report, however the functionality remains similar.

Menu Items
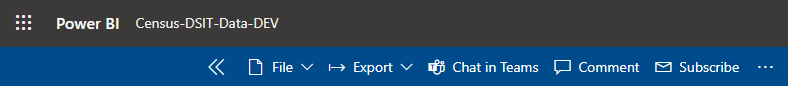
These menu items, along the top left and right of the blue bar, are available in all reports.
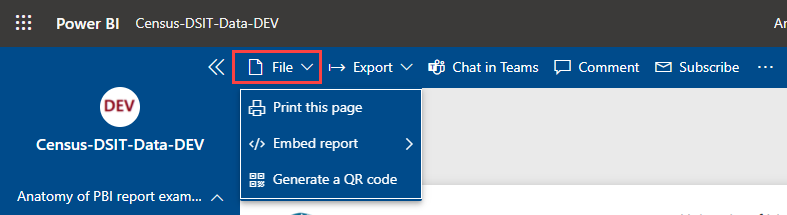
File menu

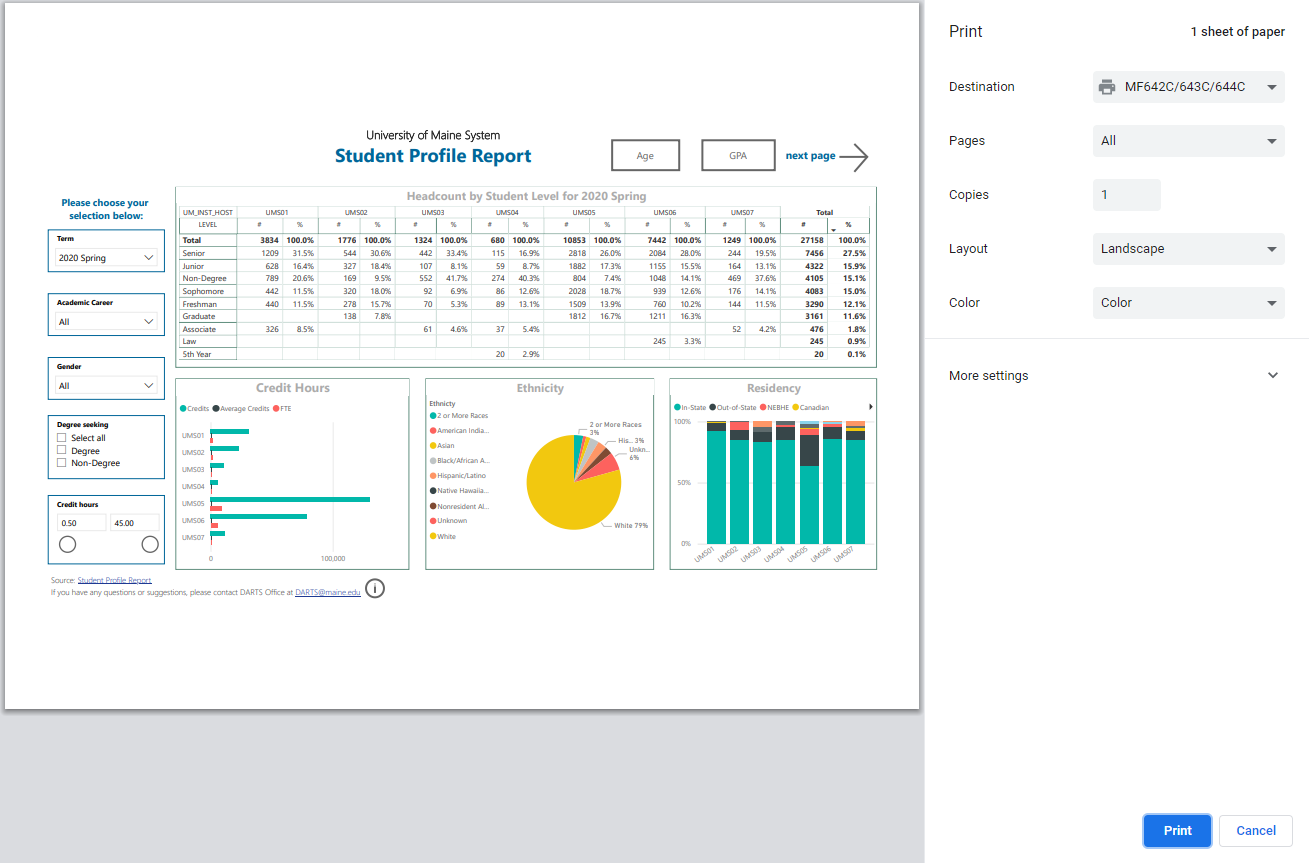
- Print this page
Selecting the print option will open your print dialogue box. Only the report area is selected to print. Choose your report options (slicers, pages, etc.) prior to printing to change what is displayed and printed.
Back to top - Embed report - this option is not available for viewers. It should only be accessed by report creators with permission from dataset administrators.
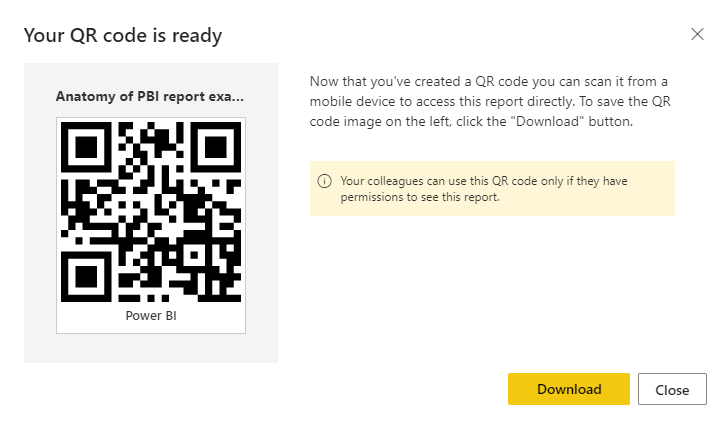
- Generate a QR code
To quickly link a colleague (with the same access to this classification level of data) to a report, you can select this option to download a QR code which will take them directly to the report.
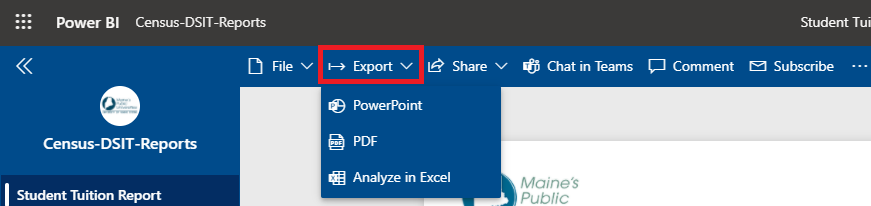
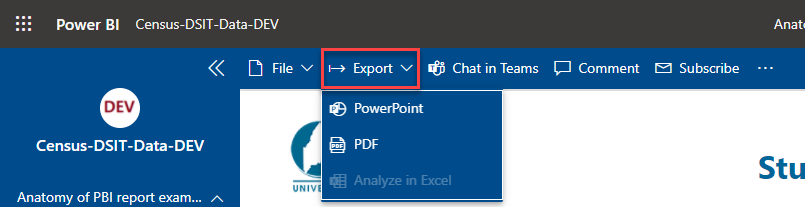
Export menu
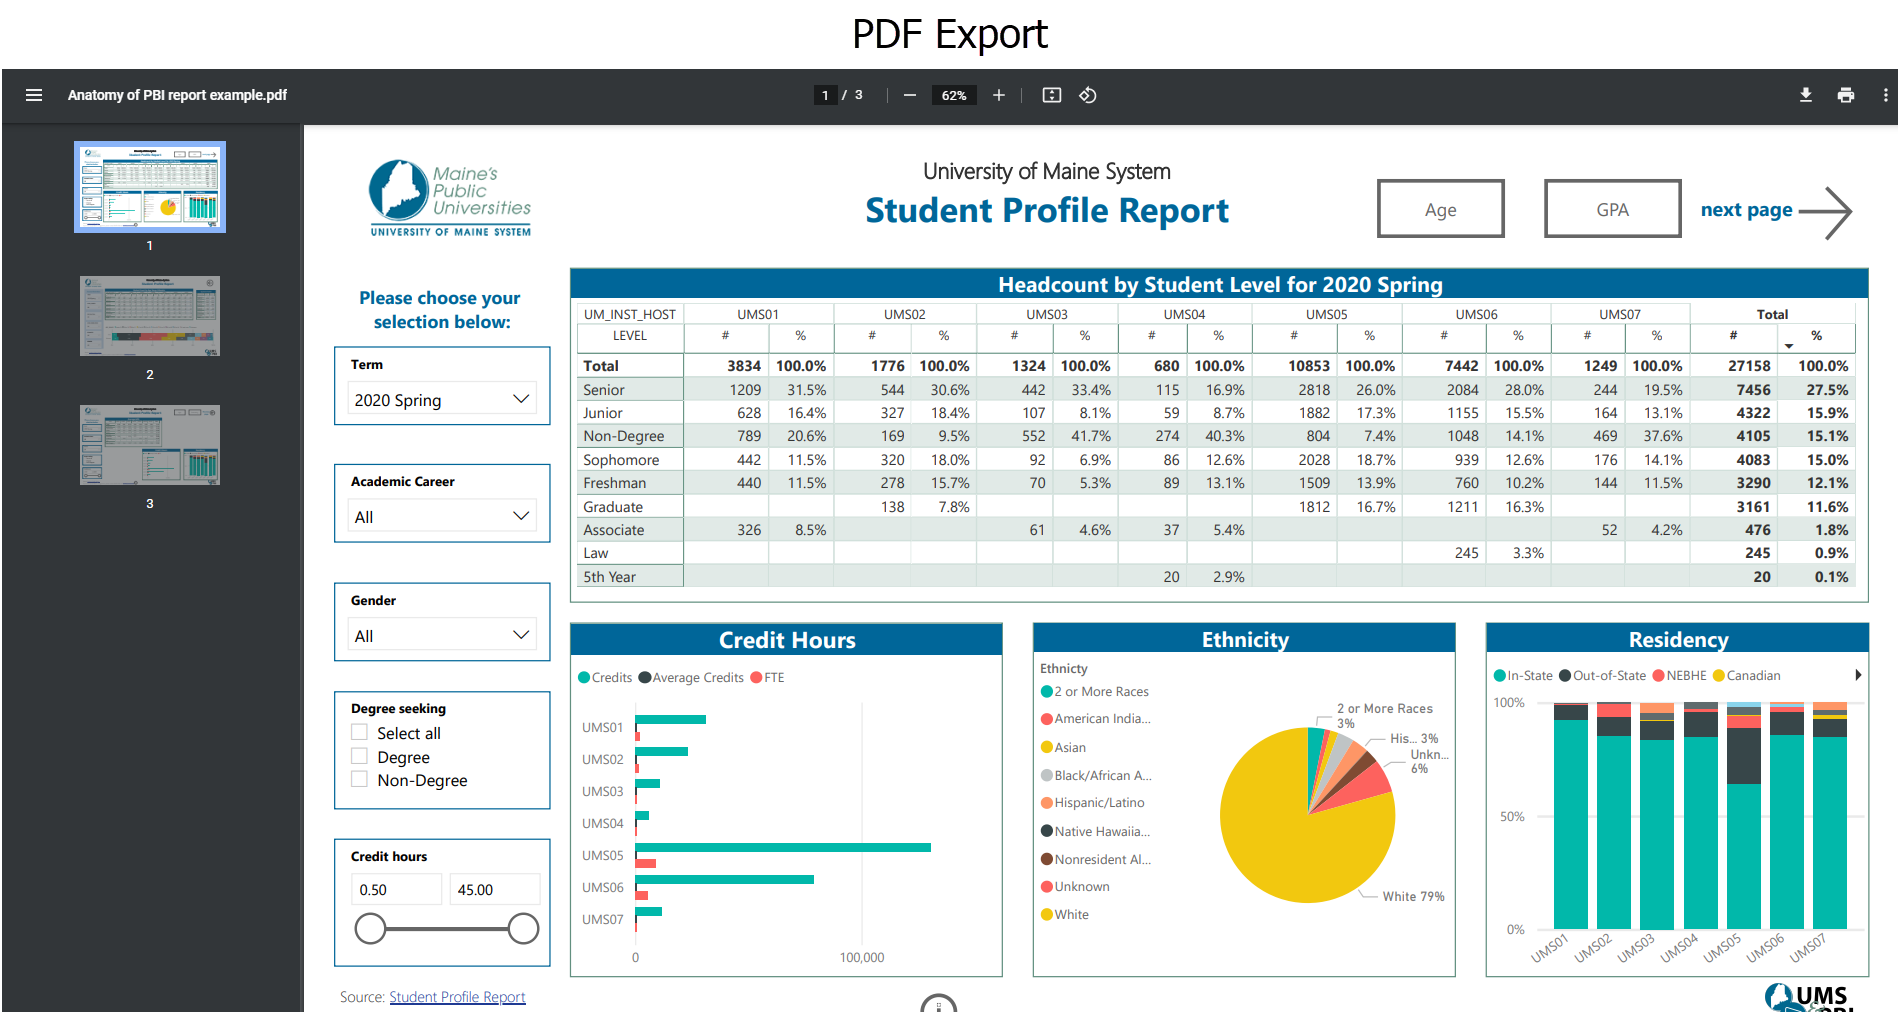
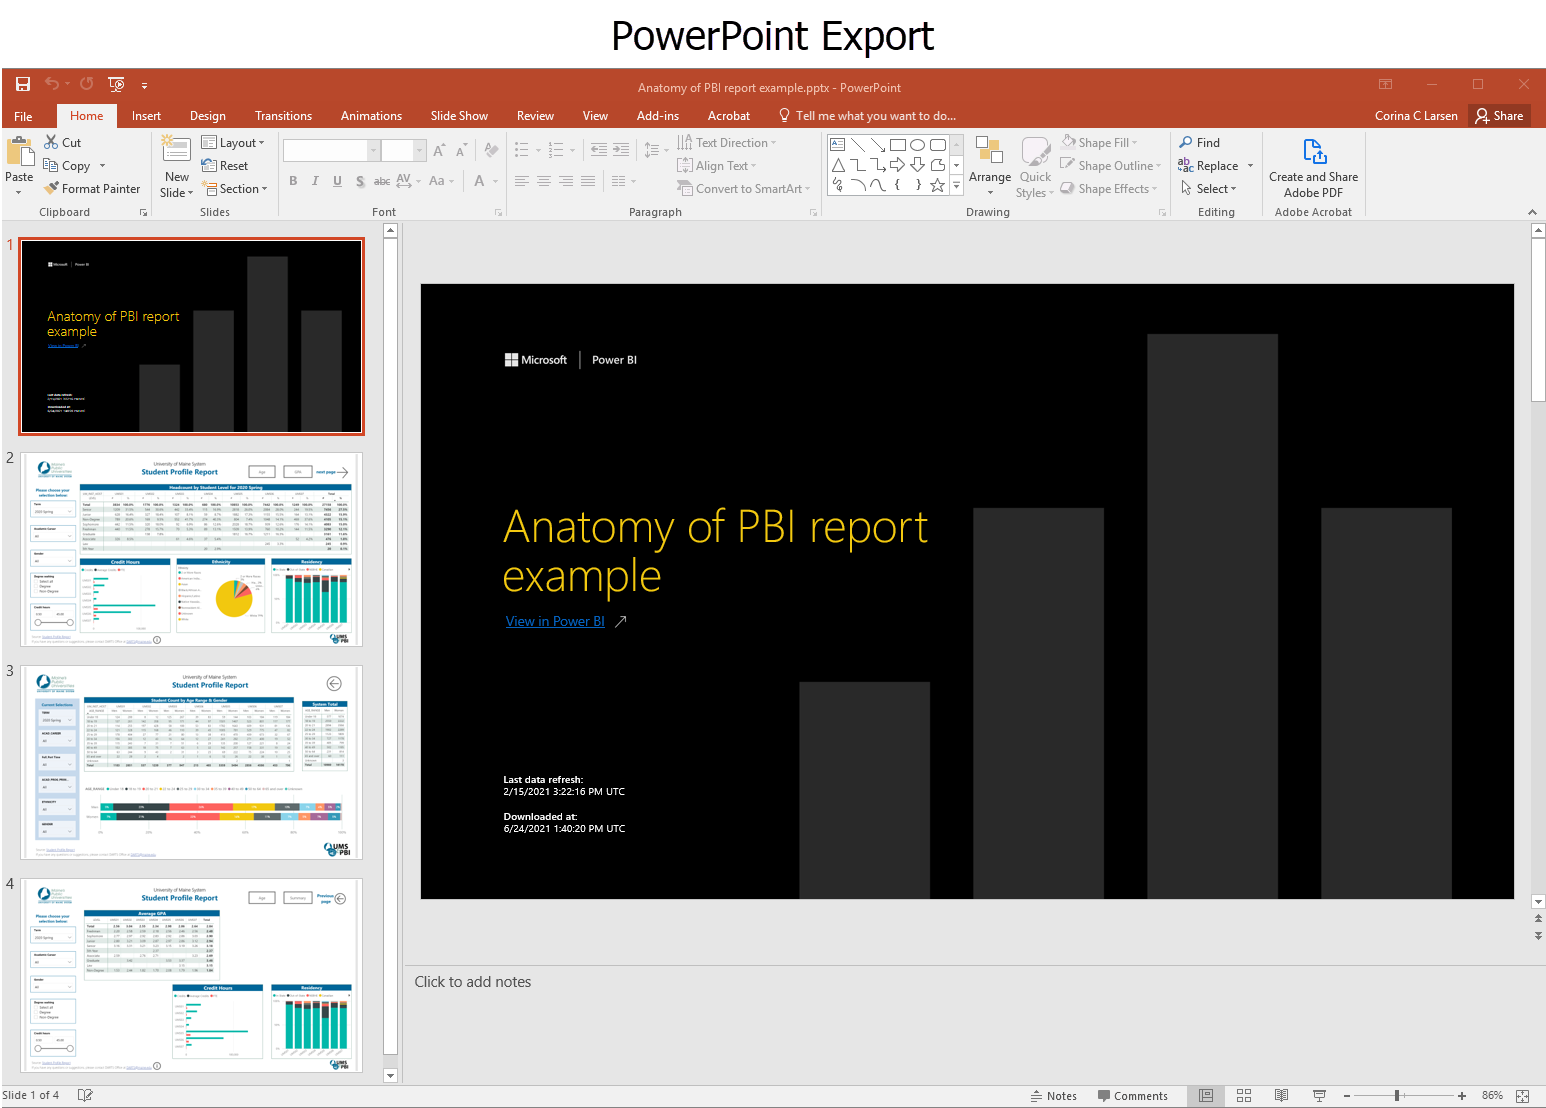
You can export an entire report either to PowerPoint or as a PDF. Be aware that these export functions only capture what is visible on the page.
- To export a PowerPoint slide or PDF
Click the drop down arrow for "Export" and choose "PowerPoint" or "PDF"

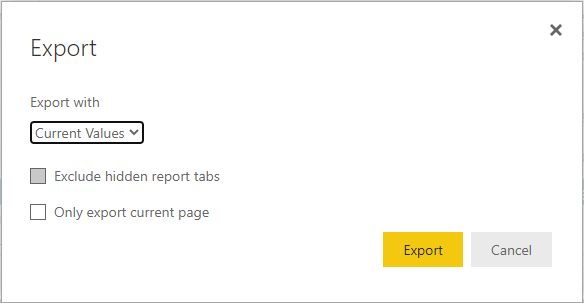
- Select from the options presented and click the "Export" button.

- Once it is completed, you can download the PDF, and the PowerPoint file will be opened automatically. As seen below, all pages can be exported at once and populate separate pages and/or slides. Additionally, PowerPoint automatically creates a title page with file information pre-filled.


- Analyze in Excel is not an available function.
NOTE: Since the export functions above only capture what is visible on the page, the data is sometimes incomplete. To remedy this, you can export the data from each visual to Excel.
Back to topChat in Teams
Microsoft Teams is part of the University of Maine System's subscription to the Microsoft Office 365 suite of tools.
Follow this link to the Microsoft documentation for using Teams with Power BI if your group uses Microsoft Teams to collaborate.
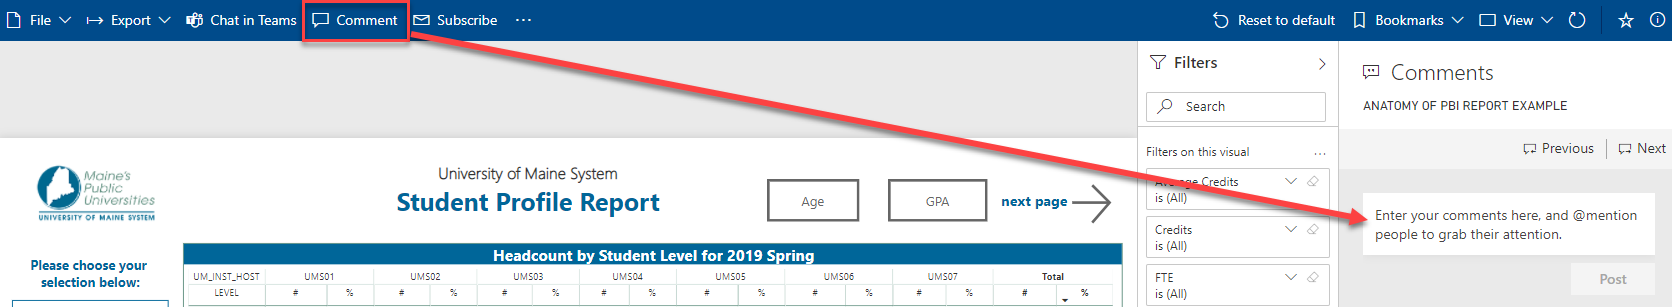
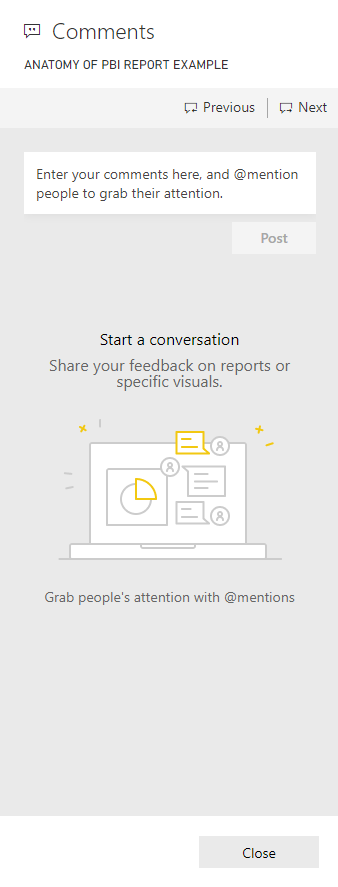
Comment
Select "Comment" from the menu to open a dialogue box on the right. @ mention individuals to share you feedback.
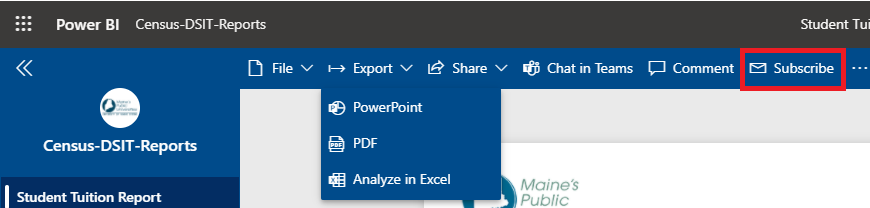
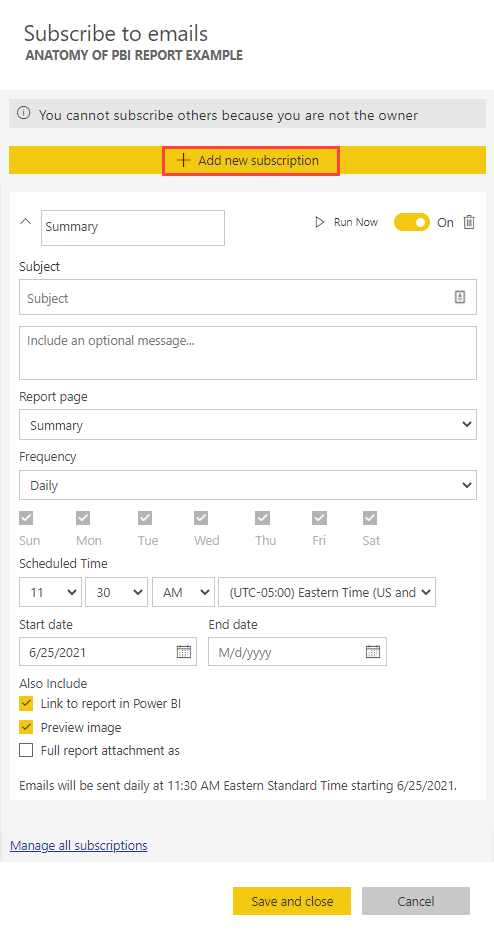
Subscribe
You can subscribe to, and email, a report. This function is helpful when the report is refreshed frequently.
- Click "Subscribe"

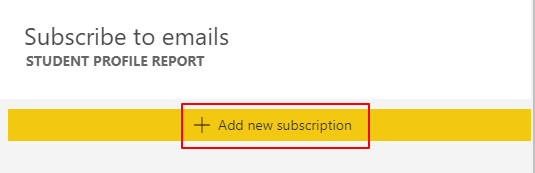
- A dialogue box opens up on the right side of the screen. Select " + Add new subscription" and the form options appear.
- Enter the required information to subscribe to regular email updates with the selected report pages
- Select "Save and close" when complete.

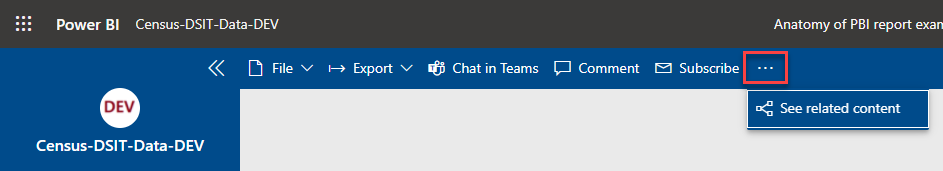
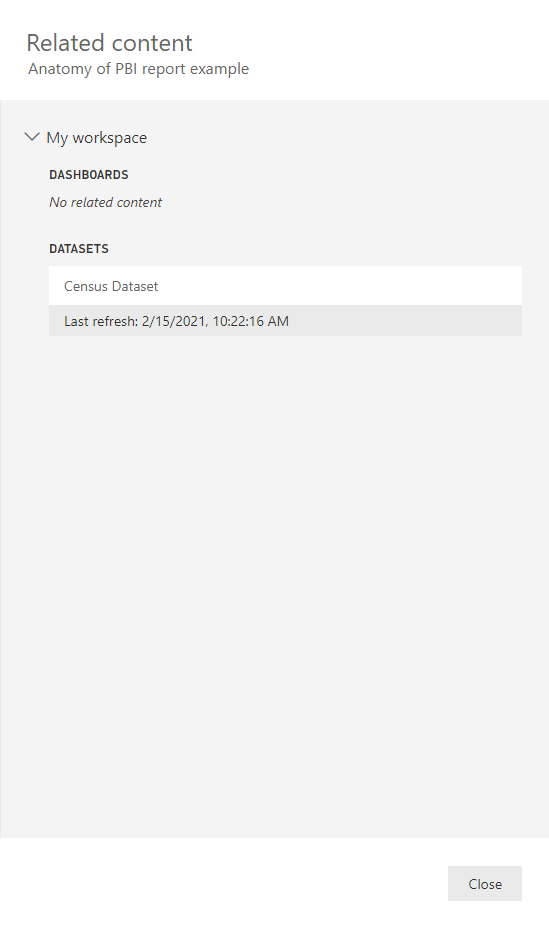
More (three dots)

- Select the three "More" dots.
- Click "See related content" to view the related content for this report and click "Close" at the bottom when done.


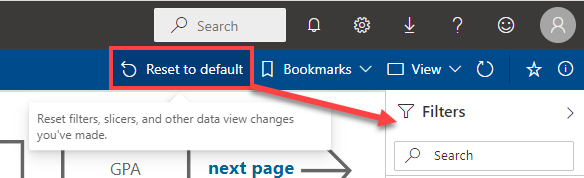
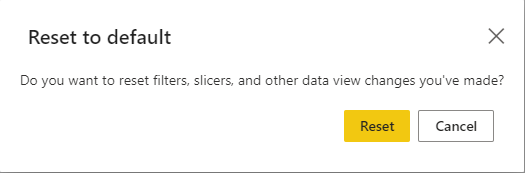
Reset to default
Use this quick and easy button to reset all filters at once. To see what filters are active, make sure the filter panel on the right side is expanded.

- Select "Reset to default"
- Click on the yellow reset button

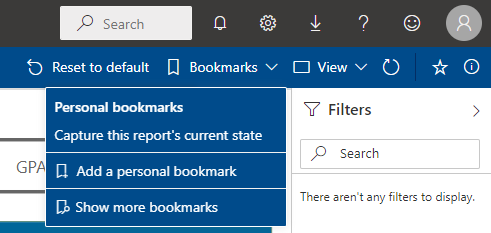
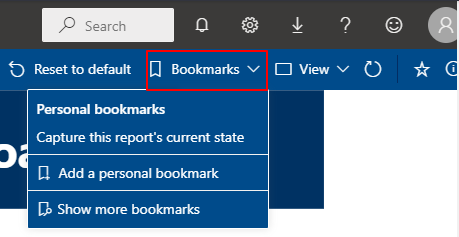
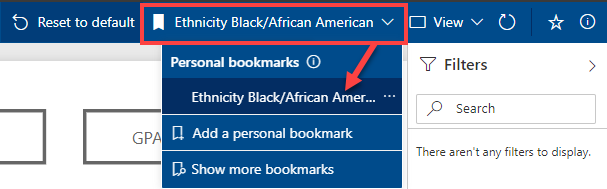
Bookmarks
Bookmarks remember your selections of the report page and slicers. When you come back to report for the next time, select the bookmarked view you desire.
- Select slicers or view of the report page for what you want to capture as bookmark
- Click "Bookmarks"

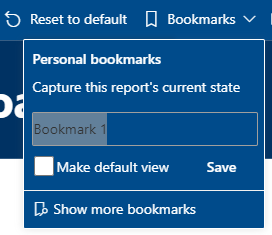
- Click "add a personal bookmark" and enter a name for the current state of the report.
- Select "Save." You can also select a specific bookmark to be the default view for the report.

- Your new bookmark will appear in the menu as well as under your "Personal bookmarks."

- Select "Reset to default" to return to the original, default report view.
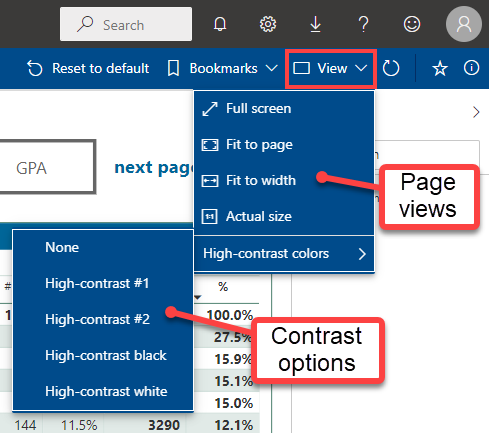
View
Select the view options to change the size of the report or change the color contrast for easier viewing.

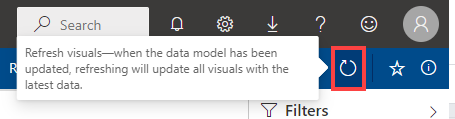
Refresh
Click on the refresh icon to refresh the data behind the visuals, ensuring the most up-to-date view of the dashboard.

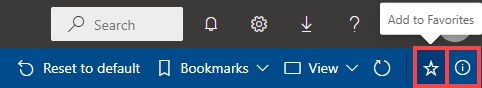
Add to favorites & Info
Select the star to add this dashboard to your Favorites menu in PowerBI.com.
For info about the dashboard, including the name, owner and description, select the info circle.
