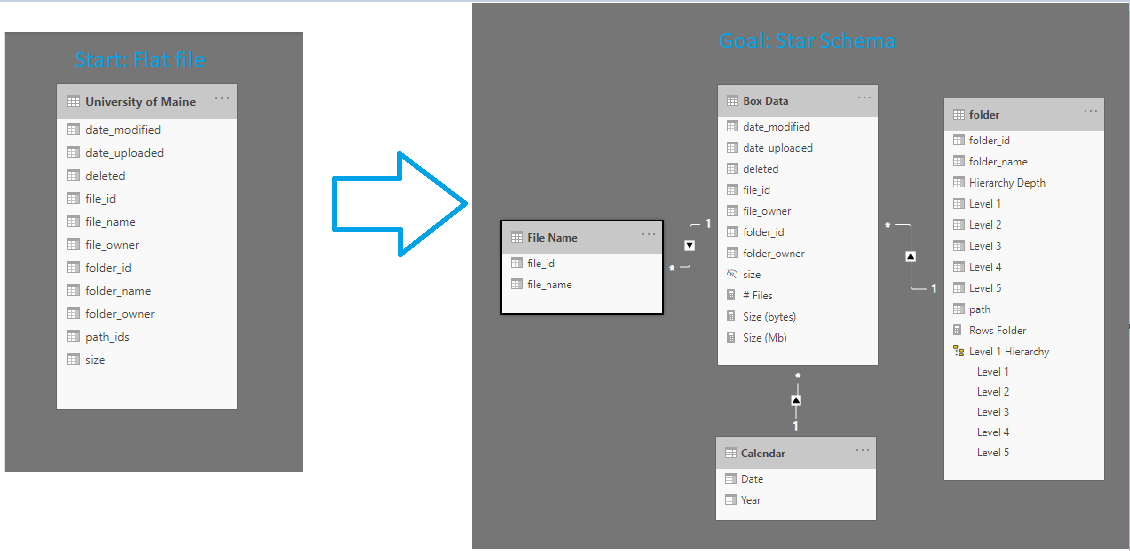
Data can be visualized in Excel, however, there are some limitations in Excel that Power BI can fix. The below is the example when you have a flat file and make it to dimension model to perform better in Power BI.
Background of this project:
The usage of Box is needed to be visualized. Here are some issues that Excel cannot handle easily.
- Data is too big (7 GB, 35 millions rows)
- Level of the tree (hierarchy) is complicated
- need to add classification (faculty/staff/ student)
Goal:
Create star schema data model based on the current flat file.
Steps:
Data set up:
Make sure data is accessible and check the data.
- The data is in SharePoint as csv file
- Connect data in PowerBI Desktop (since this data will NOT be refreshed, used get data> csv option)
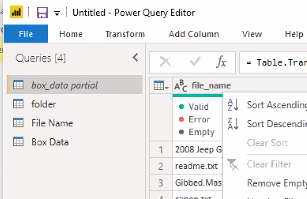
- click Transform data
- check column quality box
- Change date column
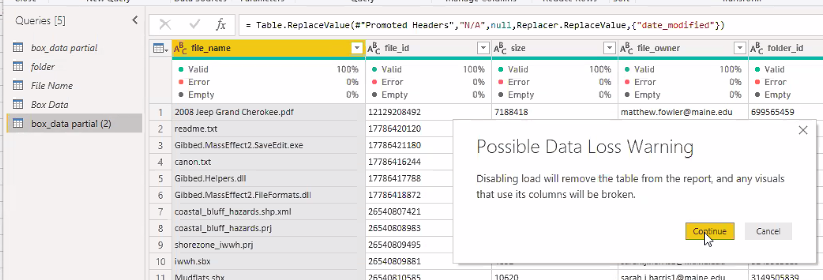
- Since there are "N/A" values, replace them to null.
- change type from abc → date
Creating dimensions:
Once you figure out which fields can go to dimension table, use reference function to create dimensions.
- Create path Dimension
- right-click on the base table and click "reference"
- rename the new table (folder)
- remove columns
- remove duplicate
- split column by delimiter
- Create File Dimension
- right-click on the base table and click "reference"
- rename new table to file name
- remove columns (file_name & file_id)
- Remove duplicate
- Go back to the base table and remove the columns (path_id, file_name & file_id)
- Create Box Data table
- right-click on the base table and click "reference"
- rename new table to "Box Data"
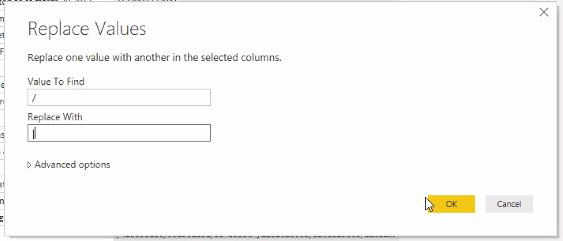
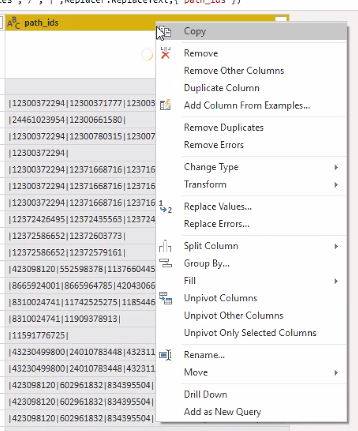
- Replace slash ( / ) with pipe( | )
- right-click path_ids column and put values on the boxes
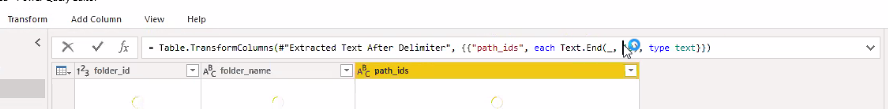
- Remove the first pipe by using "Extract" function

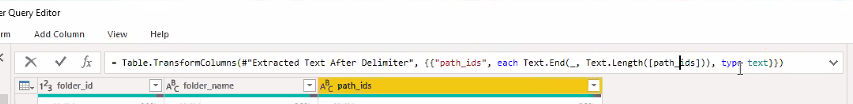
- replace with "10" for the last characters
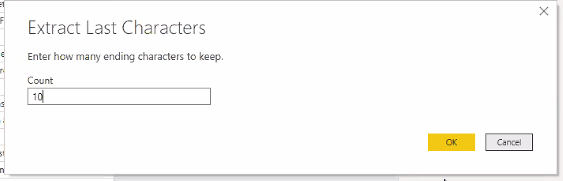
- delete 10 and type Text.Length( [path_ids ] )

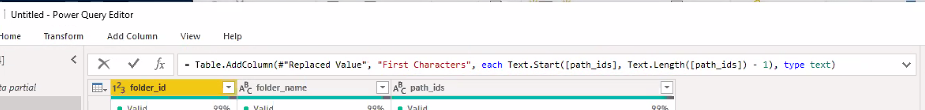
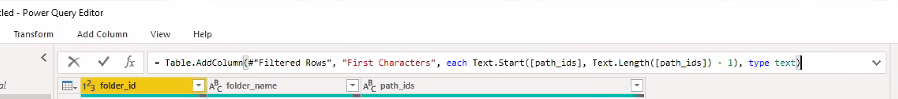
- = Table.AddColumn(#"Filtered Rows", "First Characters", each Text.Start([path_ids], Text.Length([path_ids]) - 1), type text)
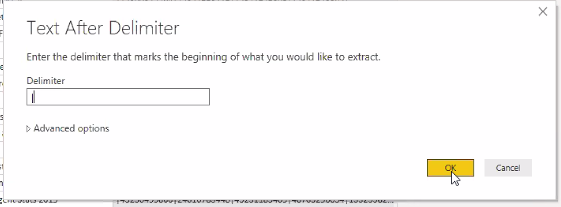
- extract > text after delimiter with 5
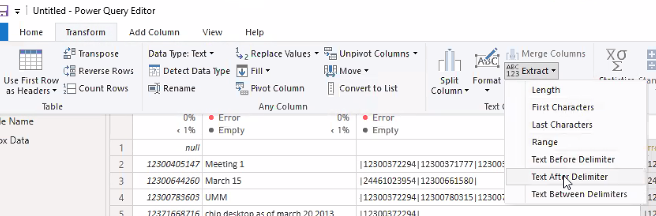
- change the column name to "path"
- Go to Box data table and remove file name & folder name columns
- remove null date
- Go back to "Home" and "Close and Apply"
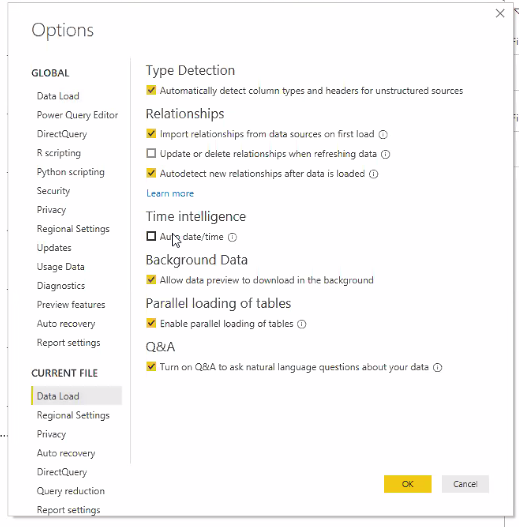
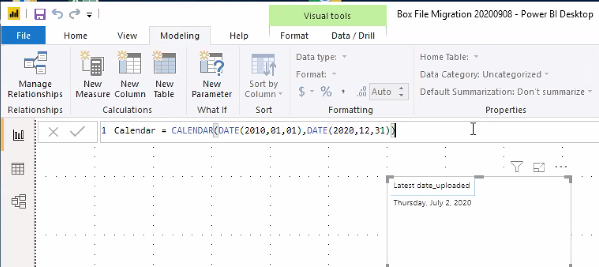
- Create Calender table (moved to Create Date/ Calendar table)
- File > Options > Data Load > uncheck the box for auto date/time
- Check the earliest date and latest date by dragging the field on the visualization pane
- Go to the Modeling tab on the ribbon
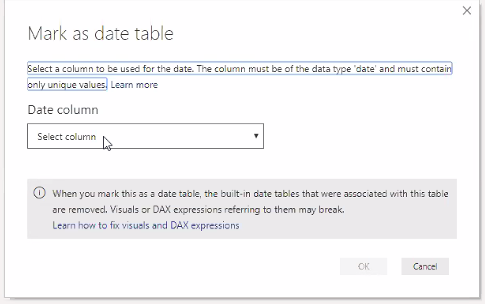
- Go to table pane and right-click the Calendar table, then choose Mark as date table
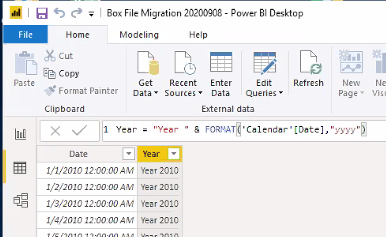
- add new column and create "year"
- Go to modeling pane and create relationships
-
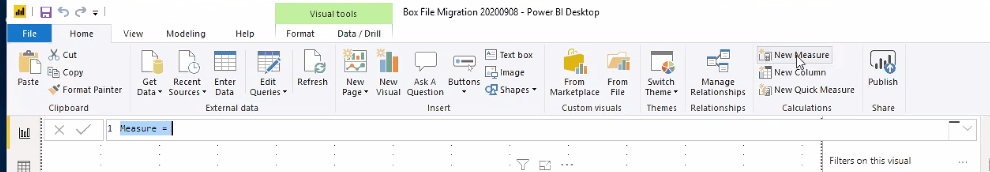
- Go back to the visualization pane and create a new measure
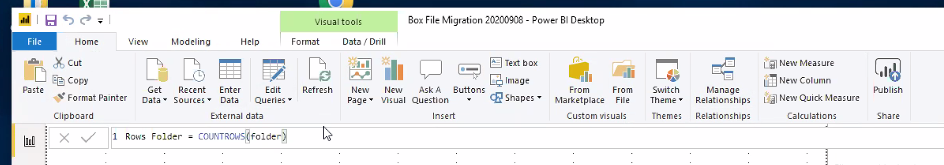
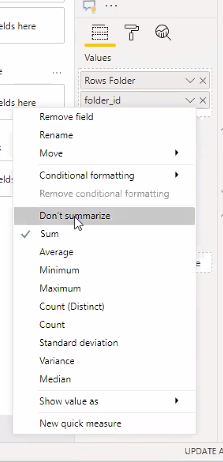
- create some table
- Choose Don't summarize
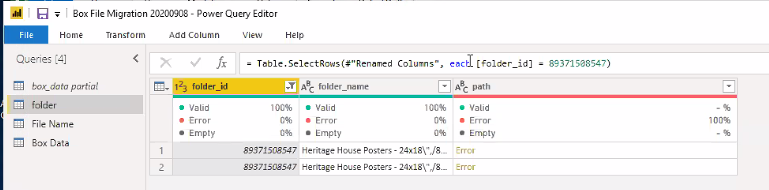
- this guy shows count=2
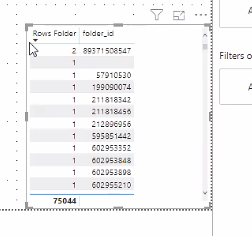
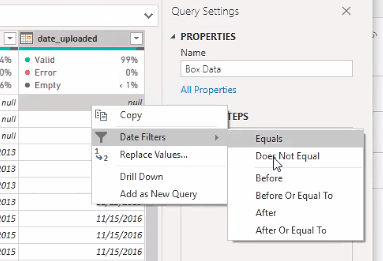
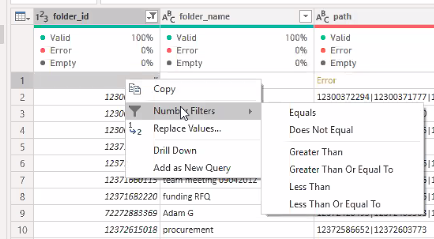
- Copy value > edit query > filter row
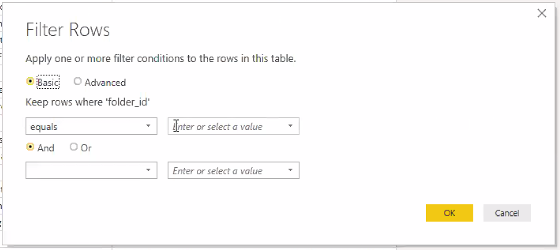
- change "=" to "<>"
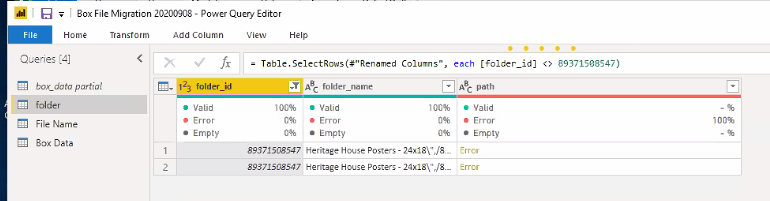
- filter null
- GO back to relationships
- New Measure: file size
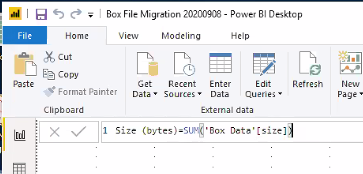
- hide the original column (size) by right-clicking the field
- New Measure: number of files (distinct)
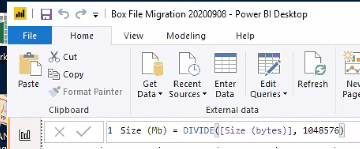
- New Measure: size (MB)
- Go back to visualization, and drag fields to create some visuals
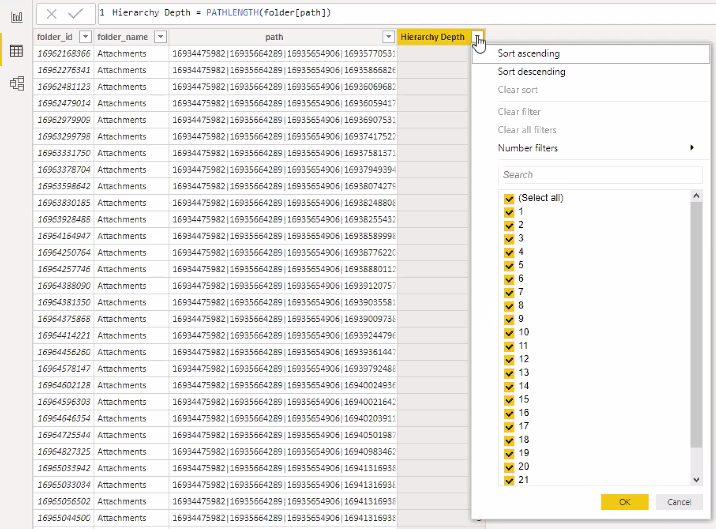
- Go to Data view and click folder and create new column: Hierarchy depth
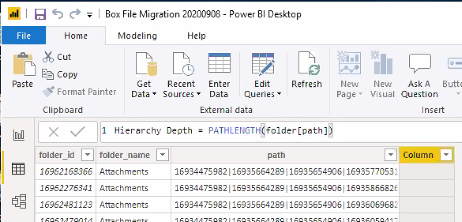
- data looks like this
- the earlier steps (changing slash to pipe) were needed because of this
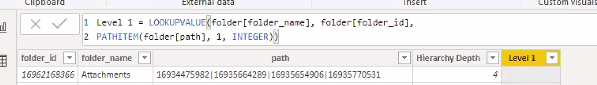
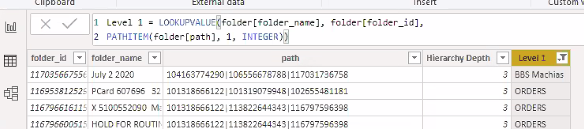
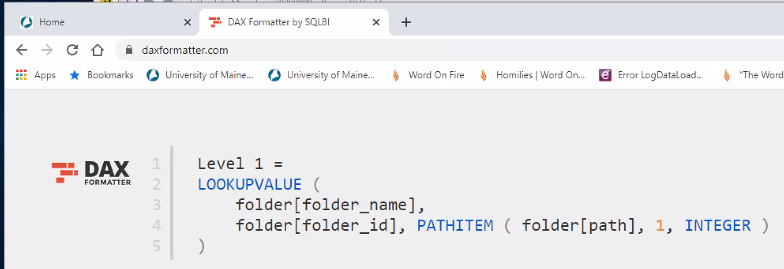
- New Column: level 1
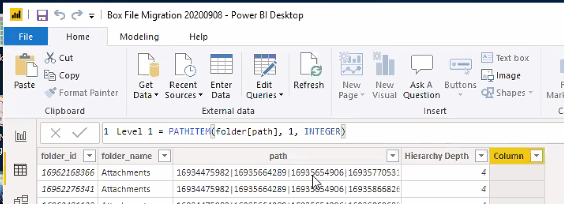
- error; insert text before the delimiter then change path_ids to path

- null is the problem

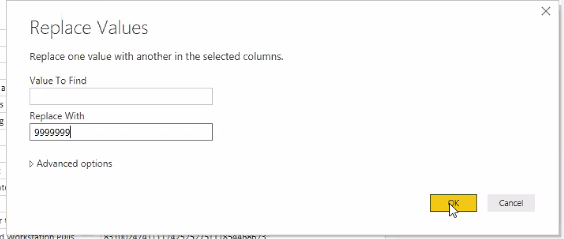
- right-click the cell > replae value
- Open Chrome and search for DAX formatter(daxformatter.com)
- copy the DAX from PBI Desktop
- Paste the code on the website
- copy the DAX from website and paste it on PBI Desktop
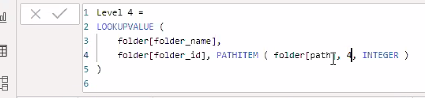
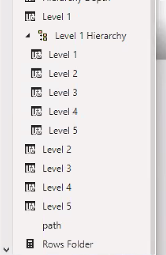
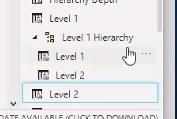
- create new columns: Level 2, Level 3, ....Level 23.
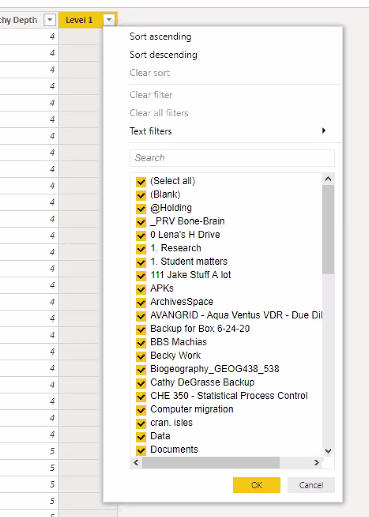
- create a hierarchy by dragging level 2 over level1 and so on...
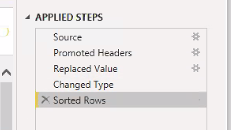
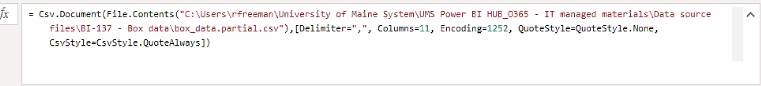
- Change the source (need full data now)
- Edit query
- click source
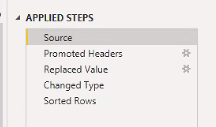
- add new path

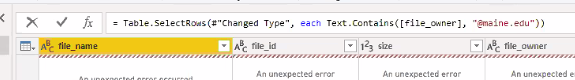
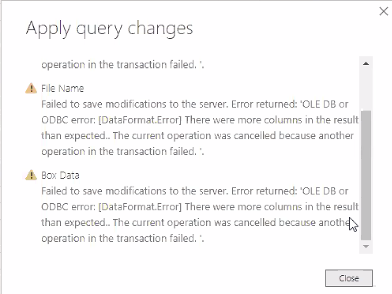
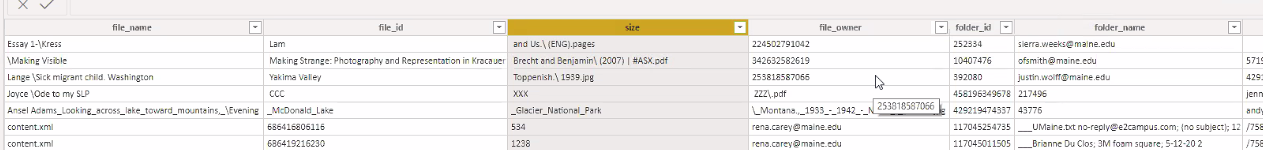
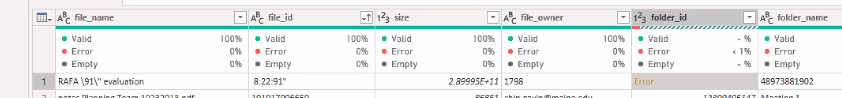
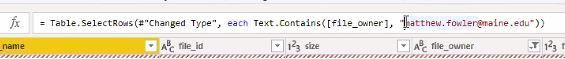
- error: comma on data breaks the report without double quotes (")
- right-click on file_owner data cell > text filter
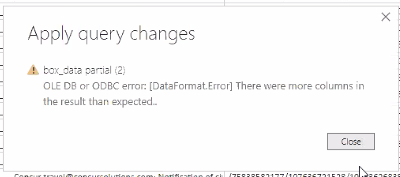
- enable data for box_data partial (2) and folder, and box data
- still error
- Tried to open the data file with Notepad ++ but the file is too big to open
- These five tows are the errors
- modify deleted column
- still error

- Notes:
- Integer is better than text
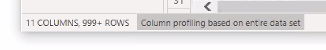
- PBI changes data type based on the top 1000 rows. Change to "based on entire data set" on the bottom left- corner of the Query Editor. Look at the data by sorting the values.
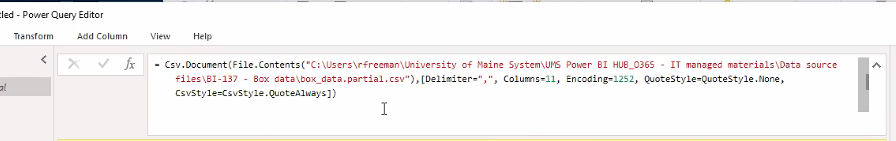
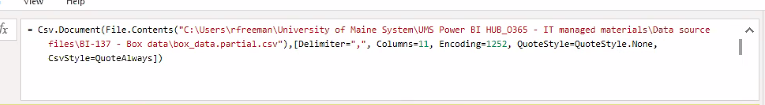
- Error:
- click the error cell
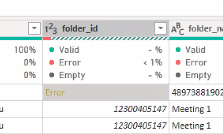
- data in this row got shifted due to the double quote (") in data
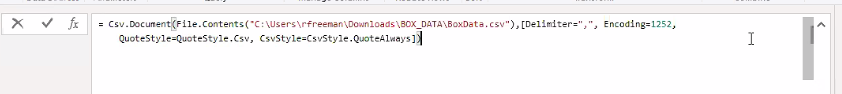
- Solutions: Type CsvStyle=CsvStyle.QuoteAlways